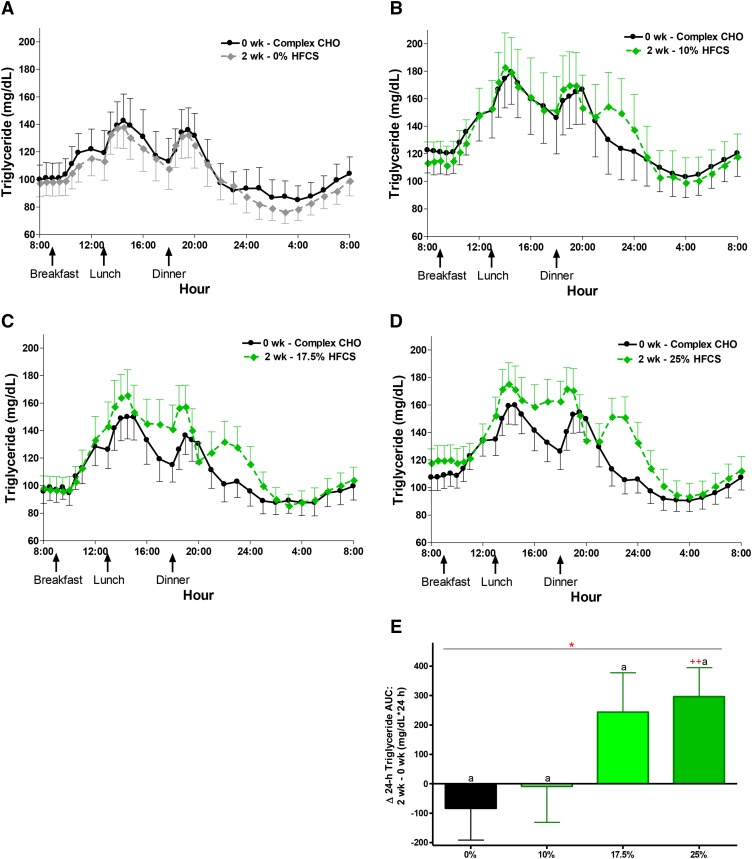
FIGURE 3.
The 24-h circulating triglyceride concentrations during consumption of complex carbohydrate and during consumption of sweetened beverages containing 0%, 10%, 17.5%, and 25% of Ereq-HFCS. Circulating 24-h triglyceride plasma concentrations during consumption of energy-balanced baseline diets containing 55% Ereq complex carbohydrate at 0 wk and during consumption of energy-balanced intervention diets containing isocaloric amounts of carbohydrate as complex carbohydrate and (A) 0% Ereq-HFCS (n = 23), (B) 10% Ereq-HFCS (n = 18), (C) 17.5% Ereq-HFCS (n = 15), or (D) 25% Ereq-HFCS (n = 28) at 2 wk. (E) The change in circulating 24-h triglyceride plasma concentrations (2 wk – 0 wk) quantified for each group as Δ24-h uric acid AUC. *P < 0.05, effect of HFCS group; 2-factor (HFCS group, sex) ANCOVA of Δ with adjustment for BMI and [outcome] at baseline. aΔ different from bΔ, Tukey’s multiple-comparisons test. ++P < 0.01, least squares mean different from zero. Significance notations in red indicate that difference did not retain significance after correction for multiple comparisons (P < 0.0031). Data are means ± SEs. CHO, carbohydrate; Ereq, energy requirement; HFCS, high-fructose corn syrup; Δ, absolute change.

