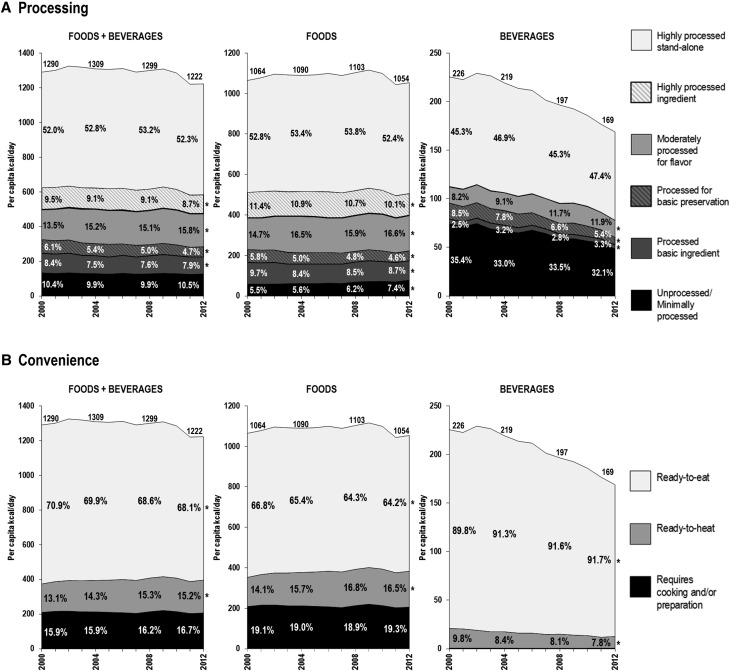
FIGURE 1.
Trends in US household food and beverage purchases categorized by the degree of industrial processing and level of convenience, Homescan 2000–2012. Weighted unadjusted mean per capita kcal/d and % kcal purchased from each category defined by (A) degree of processing and (B) convenience by year. Each uniquely barcoded food or beverage was classified into a mutually exclusive category for (A) degree of processing based on the extent to which a food was altered from its natural state by industrial food processing and the purpose of these processes and (B) convenience based on the amount of food preparation required by the consumer before a product can be eaten. Data from the 2000–2012 Homescan longitudinal panel of household purchases of consumer packaged goods. All values are weighted to be nationally representative. Percentages labeled within the graph represent estimates in 2000, 2004, 2008, and 2012. Number of year-level observations and households: foods and beverages: n = 656,184 (157,142 households); foods: n = 656,172 (157,139 households); and beverages: n = 655,833 (157,114 households). Moderately processed grain products represented ≤0.2% kcal purchased and therefore do not appear in the figure. *Significant linear trend in the contribution of a given category of processing or convenience to purchases (% kcal), determined by using survey-weighted linear regression models accounting for market-level clustering. P < 0.001 to account for multiple comparisons and sample size.

