Table 2.
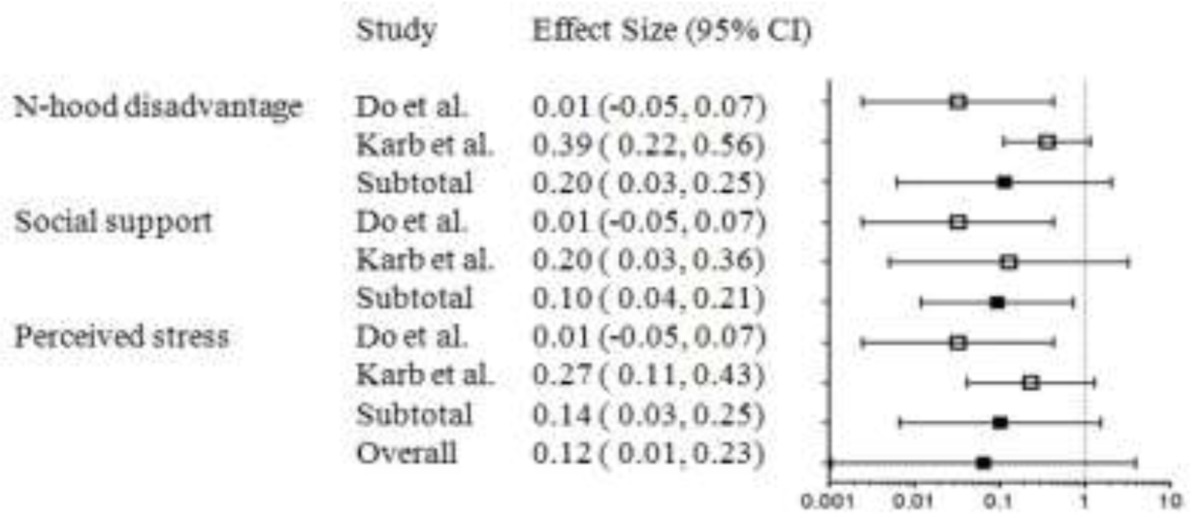
The effect Size (95% CI) and forest plot for the cortisol level for inhabitants in the lower stress neighborhoods compared with the higher stress neighborhoods

The effect Size (95% CI) and forest plot for the cortisol level for inhabitants in the lower stress neighborhoods compared with the higher stress neighborhoods
