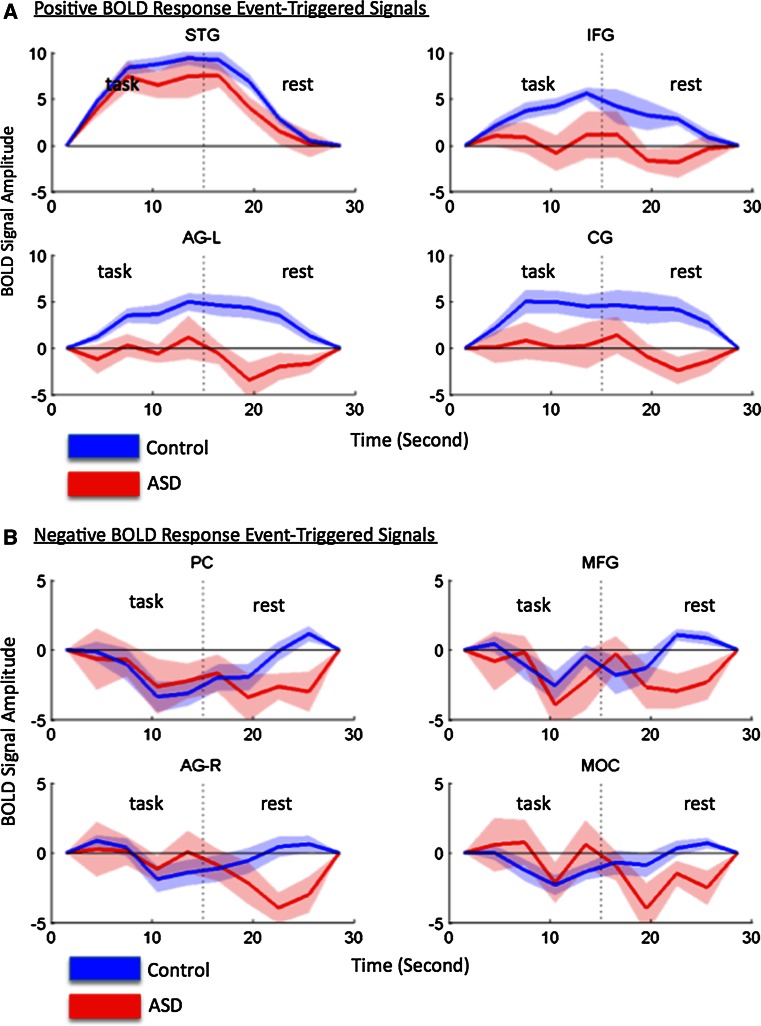
Fig. 4.
a Event-triggered averaged signals from the superior temporal gyrus (STG), inferior frontal gyrus (IFG), left angular gyrus (AG-L), and cingulate gyrus (CG), all of which displayed a PBR relative to the baseline in response to being presented with speech stimulation. The blue line corresponds to the signal of the control participants, and the red line corresponds to the signal of the ASD participants. The blue and red shadows around the lines reflect ± 1 SE of the mean. b Event-triggered averaged signals from the precuneus (PC), middle frontal gyrus (MFG), right angular gyrus (AG-R), and middle occipital gyrus (MOC), all of which displayed a NBR relative to the baseline in response to being presented with speech stimulation. The blue line corresponds to the signal of the control participants, and the red line corresponds to the signal of the ASD participants. The blue and red shadows around the lines reflect ± 1 SE of the mean

