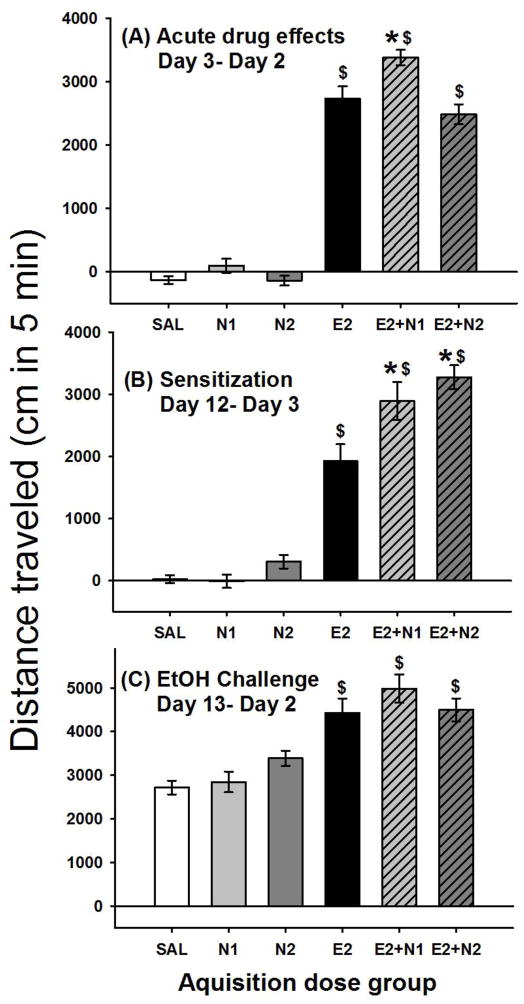
Figure 4.
Locomotor effects of nicotine and 2 g/kg ethanol. Shown is mean (± SEM) distanced traveled (cm) during the first 5 min of the 15-min activity session for (A) acute drug effect corrected for day 2 baseline (day 3- day 2); (B) sensitization during acquisition (day 12- day 3); and (C) locomotor response to the 2 g/kg ethanol challenge corrected for day 2 baseline (day 13 –day 2). Drug treatment during acquisition is shown on the x axis. N1 and N2 = 1 or 2 mg/kg nicotine tartrate; E2= 2 g/kg ethanol; SAL=saline. *: p < 0.001; for the comparison of the indicated group with the E2 group. $: p < 0.01; for the comparison of the indicated group with the SAL group.

