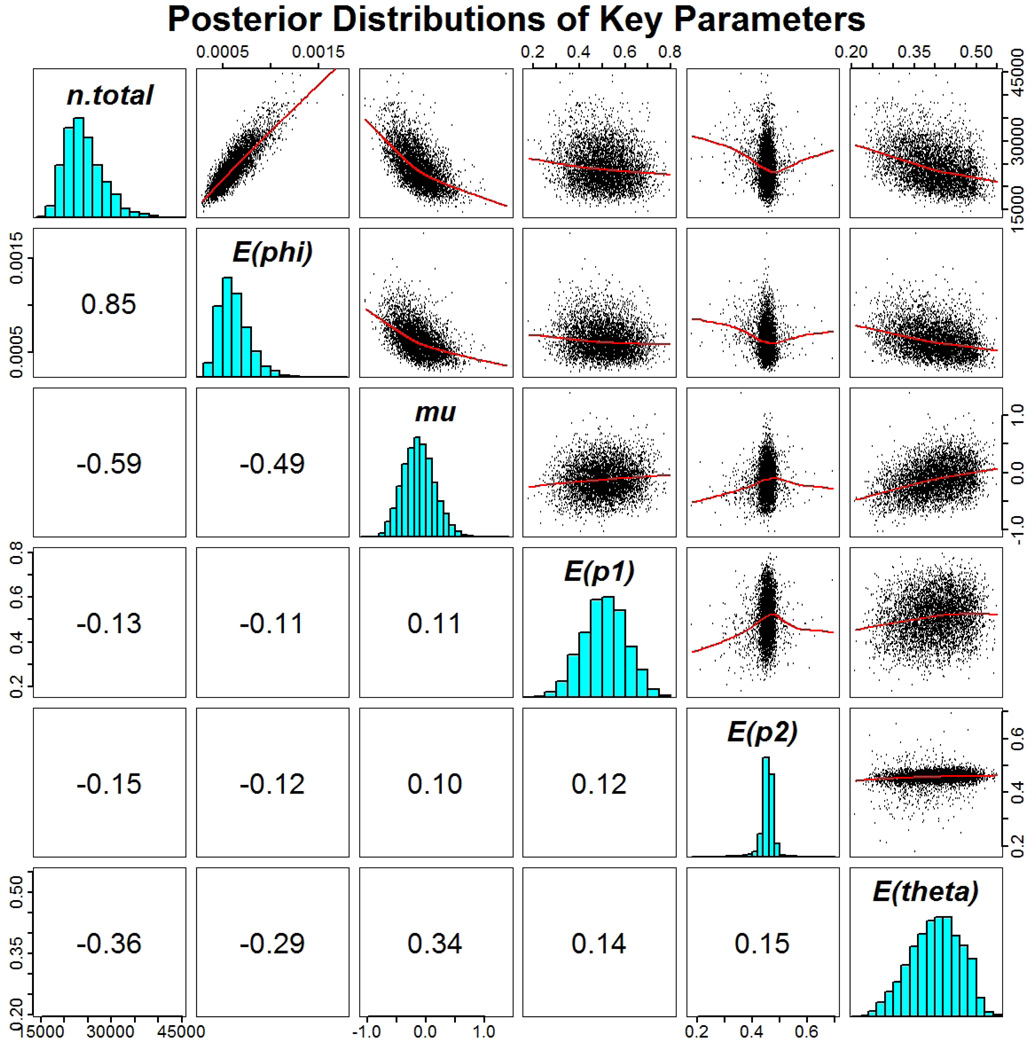
Figure 3.
Marginal Posterior Distributions of Parameters in the Bayesian Hierarchical Model for Estimating the Number of PWID: the national PWID size, the expected PWID prevalence, the bias of expert estimate, the expected NASROB participation rate, the expected BSS participation rate, and the expected NEP participation rate. The upper panels are pairs plots, the lower panels are Pearson correlations, and the panels on the diagonal are histograms.

