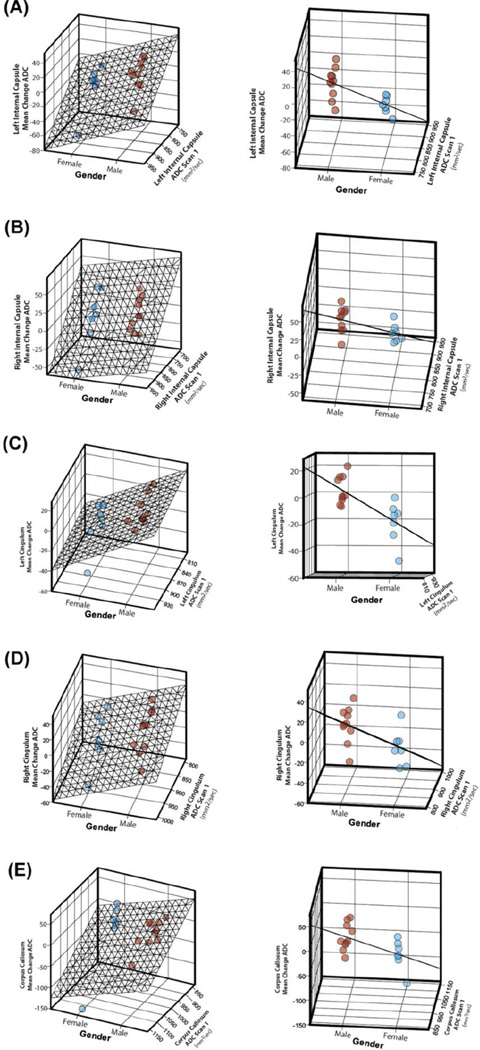
Figure 5.
Relationships among gender, baseline ADC scan measure, and mean ADC changes are illustrated for the left and right internal capsule tracts (A and B), the left and right cingulum bundles (C and D), and the corpus callosum (E). The left and right columns show the same 3-dimensional graphs but at different angles to illustrate the distribution (left column) and standard error (right column) of the mean ADC change data by gender. Blue dots indicate females, and red dots indicate males.

