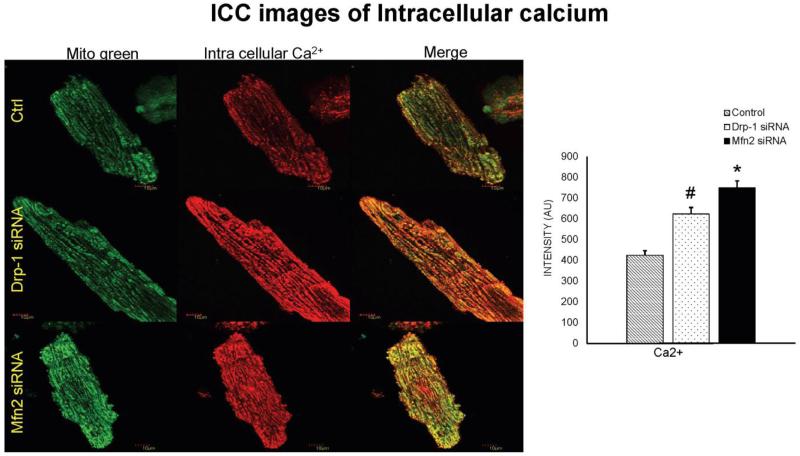
Figure 4.
Immunocytochemistry images of cardiomyocytes from control, Drp-1 siRNA and Mfn2 siRNA group stained with calcium sensitive dye (Rhod-2, AM, Molecular probes) that emits red fluorescence upon binding to calcium and Mito tracker green to label mitochondria with green fluorescence and dapi (blue) staining representing nuclei. Data represents mean ±SE from n=5 per group; *p ≤ 0.05 compared to control and Drp-1 siRNA; #p ≤ 0.05 compared control.

