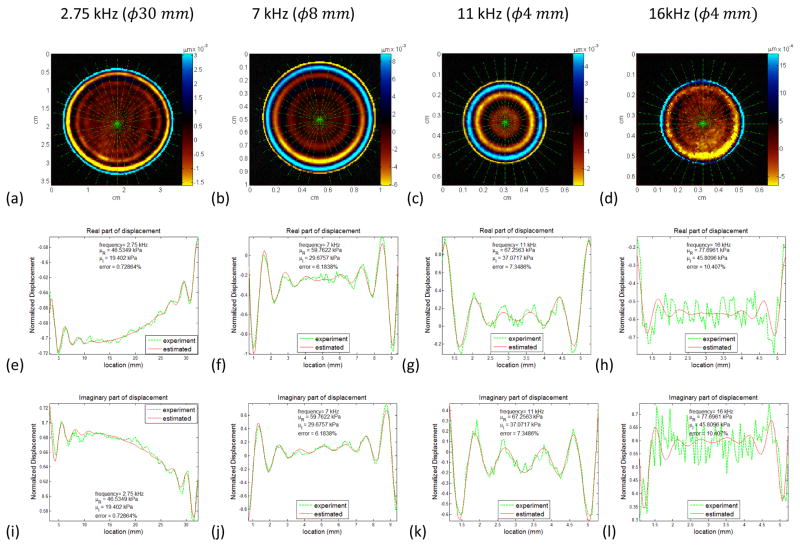
Figure 3.
Wave image and line profile with curve fitting for real and imaginary part of the displacement result for different frequencies in different sample containers. A quadratic offset strategy was utilized for fitting the closed form solution to experiment line profiles in order to compensate the uneven vibration caused by unavoidable misalignment of the actuator and the test tube. (a, e, i), (b, f, j), (c, g, k), (d, h, l) are results for 2.75 kHz, 7kHz, 11 kHz and 16 kHz from low, mid and high frequency experiments, respectively. The estimated result of the real and the imaginary part of the shear moduli and the error percentage for each fitting are indicated in the fitting plots. The Y axis for (e) to (l) are normalized displacement based on the maximum magnitude of the complex displacement over the diameter.

