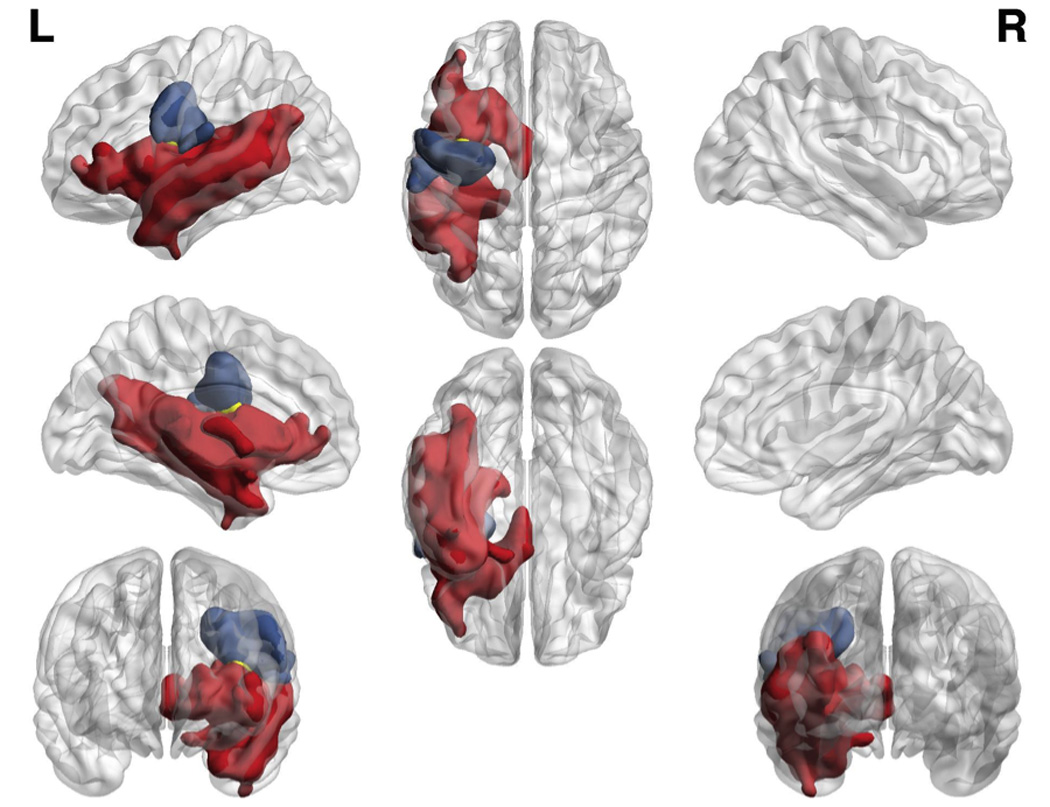
Figure 2.

Patterns of damage related to AOS (blue) and aphasia (red), and shared by both disorders (yellow). Colored regions survived a p < 0.05 threshold controlling for both multiple comparisons and the variability described by the other deficit.

Patterns of damage related to AOS (blue) and aphasia (red), and shared by both disorders (yellow). Colored regions survived a p < 0.05 threshold controlling for both multiple comparisons and the variability described by the other deficit.