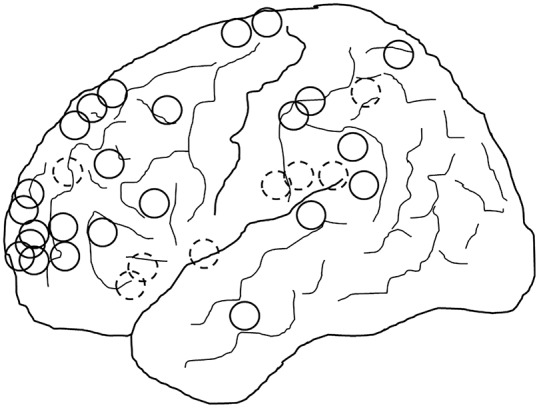
Figure 4. Location of BOSDs.

Schematic diagram showing the location of BOSDs in the 32 patients, all represented on the left hemisphere (20 right, 12 left). Full circles represent BOSDs on the cerebral convexity and hatched circles represent BOSDs on the interhemispheric surface and insula. The most common location of BOSDs was in the frontal, parietal, and insula cortex. BOSD = bottom-of-sulcus dysplasia.
