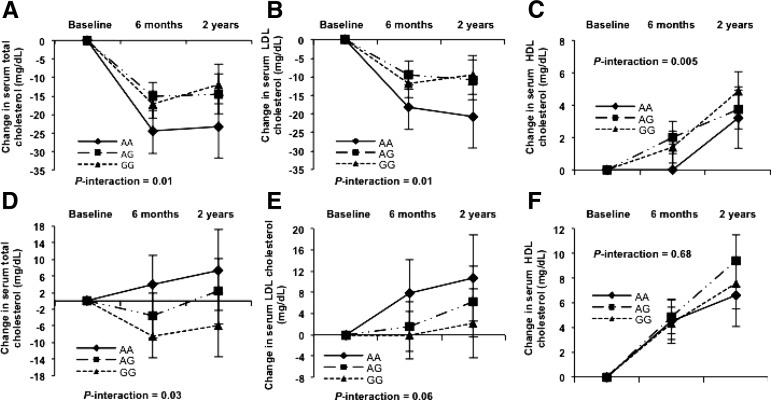
FIGURE 1.
Trajectory analysis on 2-y changes in serum total cholesterol (A, D), LDL cholesterol (B, E), and HDL cholesterol (C, F) by LIPC rs2070895 genotype of participants that consumed the low-fat (upper panels) or high-fat (lower panels) diets. The number of participants in the low-fat diet group (A–C), for AA: n = 30 at baseline, n = 22 at 6 mo, and n = 20 at 2 y; AG: n = 138 at baseline, n = 118 at 6 mo, and n = 101 at 2 y; and GG: n = 204 at baseline, n = 182 at 6 mo, and n = 155 at 2 y. The corresponding numbers in the high-fat diet group (D–F), AA: n = 32, 24, and 20, at baseline, 6 mo, and 2 y, respectively; AG: n = 130, 110, and 98, at baseline, 6 mo, and 2 y, respectively; and GG: n = 209,180, and 149, at baseline, 6 mo, and 2 y, respectively. Values are adjusted means ± SEs after adjusting for age, sex, ethnicity, baseline BMI, weight loss, and baseline values for respective outcomes. P-interactions were derived from the linear mixed models, in which intervention time was treated as a repeated measurement factor, and genotype time as the interaction terms. LIPC, hepatic lipase gene.

