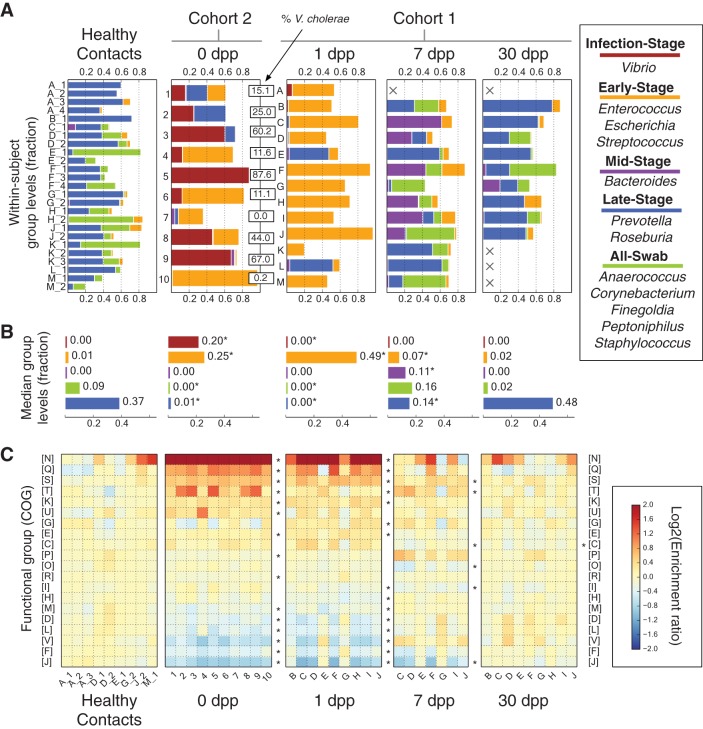
FIG 2 .
Gut microbial succession in the weeks following V. cholerae infection. (A) Abundance of gut bacteria from the two cohorts over time. To simplify analysis, bacterial OTUs were collapsed at the genus level. Highly correlated genera were further grouped and named according to their dynamics. Cholera patients are shown at 0 dpp (cohort 2; labeled by subject ID) or from 1 dpp onwards (cohort 1; labeled by household ID). Microbiota from healthy household contacts in cohort 1 are shown in the healthy contacts group and distinguished by numbers following their household IDs; these samples were collected at the same time as patient 1-dpp samples. Absent samples are labeled with an X. The percentages of 16S rRNA reads associated with V. cholerae among subjects at 0 dpp are shown in boxes (median, 25%). (B) Median group abundances across subjects. Abundance values are also shown next to the bars. Significant differences relative to controls are labeled with an asterisk (P < 0.05; two-sided Mann-Whitney U test). (C) Microbial gene abundances, grouped using the COG hierarchy of functions (82). Gene levels are shown relative to median values in healthy subjects and are organized by subject (columns) and COG category (rows). Red boxes indicate gene functions enriched in subjects, relative to healthy controls, while blue boxes denote gene functions that are rarer. Categories labeled with asterisks to the right of a given recovery stage have significantly different abundances at that stage compared to controls (q < 0.05, Mann-Whitney U test). Rare COG categories (median fractional abundance, <0.0001 in healthy controls) are not shown here but are provided in Table S4 in the supplemental material, along with median COG abundances and full COG category names.

