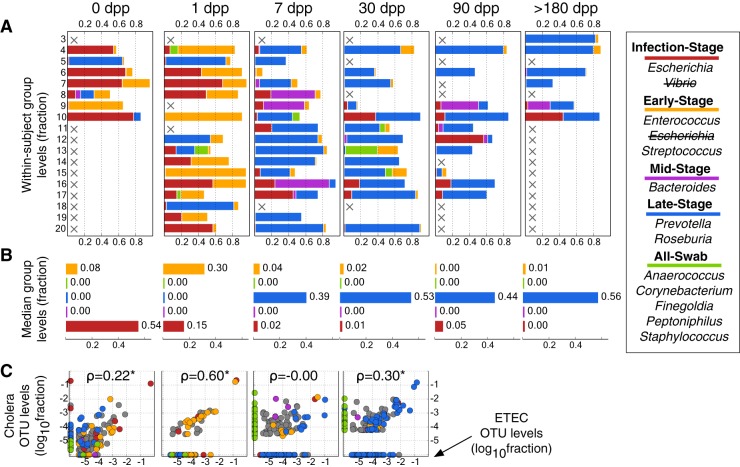
FIG 3 .
Gut microbial succession after ETEC infection. (A) To test the generalizability of the clustering model used for cholera infection (Fig. 2), a similar model was applied to longitudinal gut microbiota surveys from subjects infected with ETEC. The original Fig. 2 model was slightly modified to reflect Escherichia coli as the causal pathogen. Absent samples are labeled with an X. (B) Median group abundance levels across subjects. (C) Individual OTU abundances at each sampling date (x axis), compared to their abundances in cholera patients at corresponding times. OTUs are colored by group, with taxa that were not assigned to groups shown in gray. Spearman correlations (ρ) are shown and labeled with asterisks if P was <0.05. A pseudocount of 1e−6 has been added so that OTUs with 0 abundance can be seen.

