
FIG 6 .
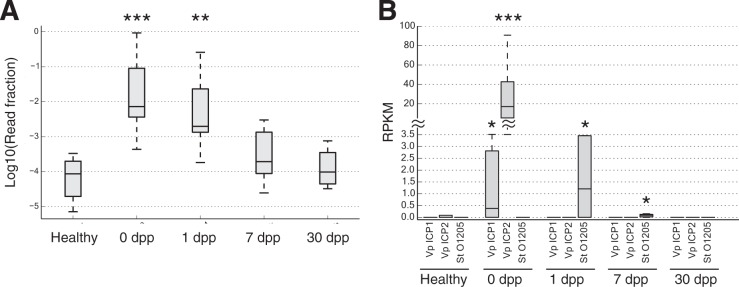
Phage succession following cholera recovery. (A) Box plots showing distributions of metagenomic reads mapping solely to viral genomes at each stage of infection. Viral levels are elevated by nearly 2 orders of magnitude in acute cholera infection (0 dpp), relative to healthy samples (***, P < 0.001, two-sided Mann-Whitney U test). Viral DNA levels remain significantly elevated at 1 dpp (**, P < 0.01) but return to normal levels 7 dpp after infection (P > 0.05). Box inner bands indicate median enzyme abundances, tops and bottoms span the first and third quartiles, and whiskers denote 1.5 times the interquartile range. (B) Specific phage levels. Three phage taxa showed significant temporal variation (q < 0.1, Kruskal-Wallis test): Vibrio phage ICP1 (Vp ICP1), Vibrio phage ICP2 (Vp ICP2), and Streptococcus thermophilus temperate bacteriophage O1205 (St O1205). The vibriophage peaked in abundance at 0 dpp, while the streptococcus phage peaked a day later. Box plots show medians and upper/lower quartile reads normalized to reads per kilobase per million mapped (RPKM). Time points where phage abundances were significantly different from healthy controls are denoted by asterisks (two-sided Mann-Whitney U test): *, P < 0.05; **, P < 0.01; ***, P < 0.001.