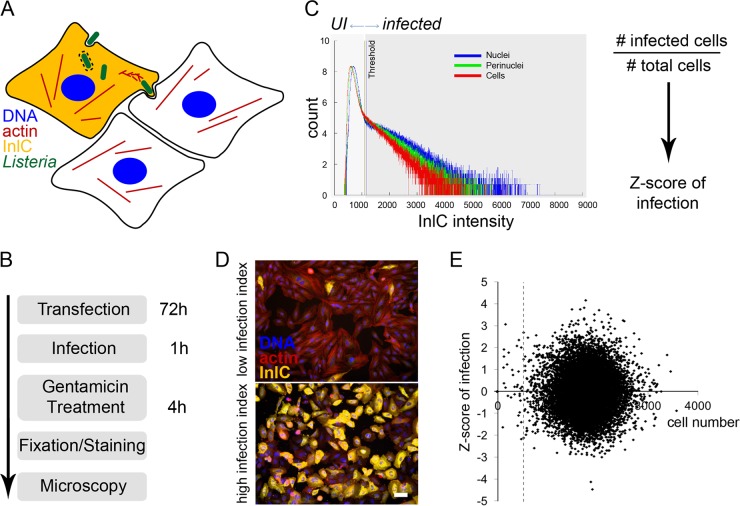
FIG 1 .
Screening strategy for an image-based siRNA screening of Listeria infection. (A) Cellular infection by Listeria was assessed by immunofluorescent detection of the protein InlC, which is secreted by intracellular bacteria and accumulates in the cytoplasm of infected cells. Bacteria were detected by expression of EGFP, the actin cytoskeleton was detected using fluorescent phalloidin, and nuclei were stained with DAPI. (B) The infection screening protocol included 72 h of HeLa cell reverse siRNA transfection, 1 h of infection with overnight-grown EGFP-expressing Listeria, gentamicin treatment for 4 h to kill extracellular bacteria, sample fixation and staining with antibodies and fluorescent dyes, and automated microscopy. (C) A binary quantification of infection (UI, uninfected versus infected cells) was established by thresholding the InlC intensities in nuclei, the perinuclear region, and in the cytoplasm of HeLa cells. The Z score of infection for a given gene was calculated as z = (x − µ)/σ, in which x is the infection index (no.of infected cells divided by the total no. of cells in a well of a 384-well plate), μ is the infection index mean per plate, and σ is the standard deviation (SD) of the infection index per plate. (D) Representative examples are shown of cells displaying low (up) or high (down) infection indexes according to the proportion of InlC-positive cells (yellow signal). Bar, 50 µm. (E) Scatter plot showing the cell number on the horizontal axis and Listeria infection levels on the vertical axis. Values are averages of 2 genome-wide screens. The dashed line shows the threshold of 500 imaged cells per well.

