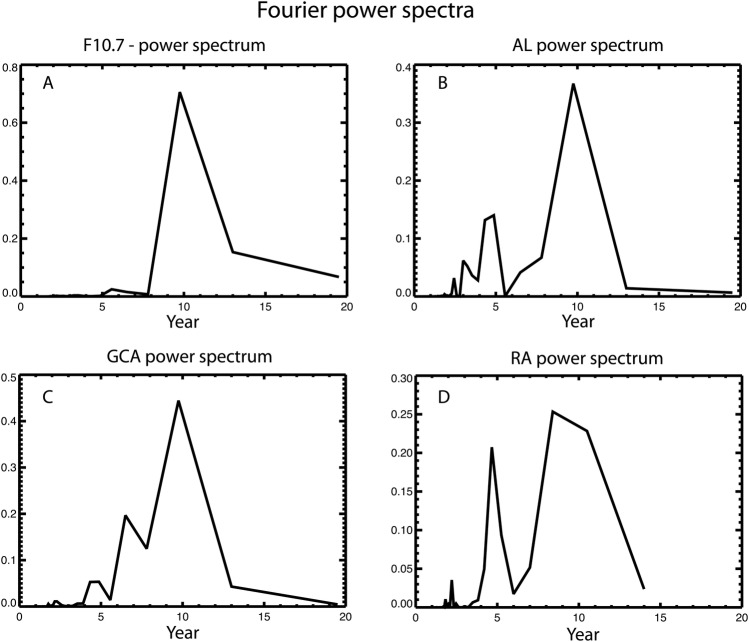
Figure 3.
The power spectra of F10.7 (A), AL (B), giant cell arteritis (GCA) incidence rate (C), and rheumatoid arthritis (RA) incidence rate (D). The x-axis shows the cycle period. Each spectrum of the power spectra has been normalised so that the total power is one. The F10.7 power spectrum peaks at 10 years, suggesting that F10.7 has a cycle with a 10-year period (A). AL and GCA incidence rates have a period of about 10 years, whereas RA incidence rate has an 8–11-year period (B–D). AL, GCA and RA incidence rate power spectra show a secondary peak (periodicities) at about 4–5 years, but F10.7 does not.

