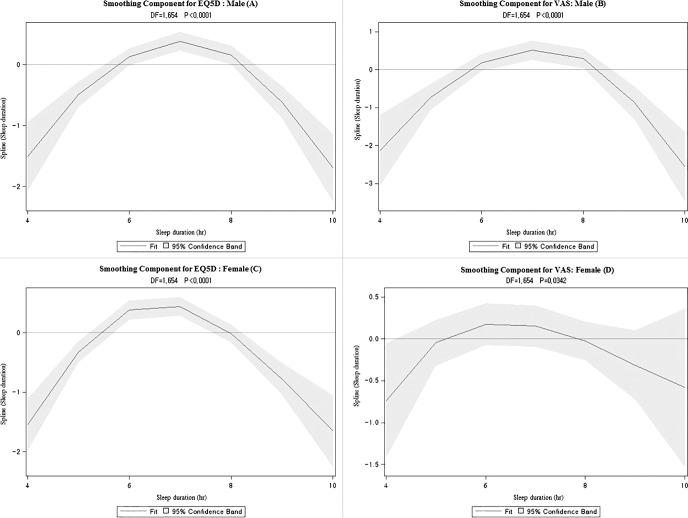
Figure 1. Association between sleep time and quality of life index using the generalized additive model.
(A) Differences in EQ-5D according to sleep time in males. (B) Differences in visual analog scale (VAS) according to sleep time in males. (C) Differences in EuroQol-5 Dimension (EQ-5D) according to sleep time in females. (D) Differences in VAS according to sleep time in females. From the generalized additive model (GAM) adjusted for age, household income level marital status, occupation, residential region, smoking status, frequency of alcohol use, number of days of walking per week, body mass index, perceived health status, depression diagnosed by doctor, and number of chronic disease. DF, degrees of freedom.

