
Fig. 2.
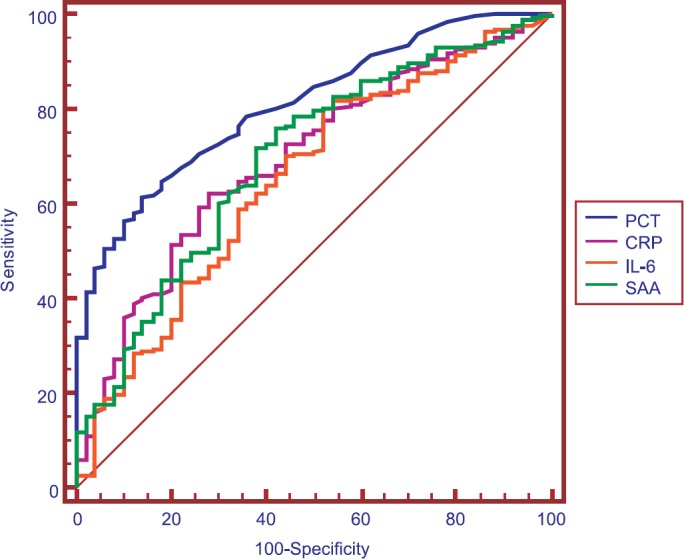
Receiver operating characteristic (ROC) curve demonstrating sensitivity as a function of one-specificity for distinction between patients in the bacterial infection groups (group 1 and 2) and patients in the non-bacterial infection group (group 3) based on procalcitonin (PCT), C-reactive protein (CRP), interleukin-6 (IL-6) and serum amyloid A (SAA) levels. PCT, CRP, IL-6 and SAA had areas under the ROC curve of 0.804, 0.693, 0.658 and 0.687, respectively.