FIG 4.
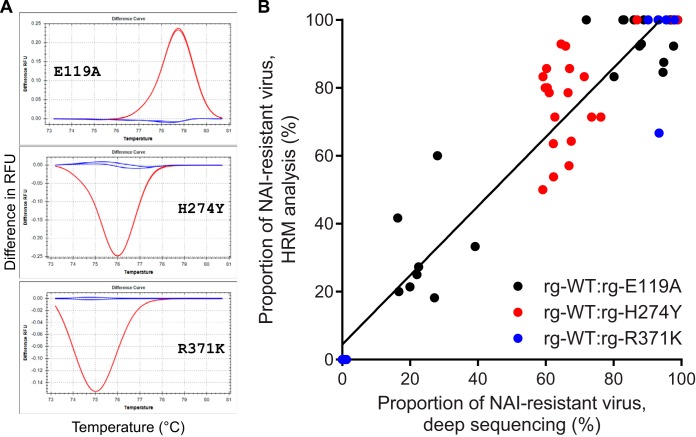
Correlation of deep sequencing and high-resolution melt analysis in determining the proportions of NAI-susceptible and -resistant influenza B viruses following coinfection of NHBE cells. (A) Examples of the different melt curves used for the analysis by HRM of individually purified plaques derived from mixed viral populations are shown. Each graph shows the difference between the number of relative fluorescence units (RFUs) of the WT (blue lines) and those of each of the 3 single-nucleotide substitution-containing templates (red lines) over increasing temperatures (°C). Analyses were performed by using Precision Melt Analysis software (v1.2; Bio-Rad). (B) The percentage of NAI-resistant viruses determined by the results of deep sequencing variant call analysis is plotted against the percentage of NAI-resistant viruses determined by HRM analysis of individually purified plaques for three pairs of virus mixtures: rg-WT and rg-E119A, rg-WT and rg-H274Y, and rg-WT and rg-R371K. Data obtained from all time points (24, 48, 72 h p.i.) and with all NAI concentrations (0, 1, and 10 μM oseltamivir and 1 and 10 μM zanamivir) are shown for each of the three mixtures. The result of linear regression analysis of all samples is depicted by a solid black line.

