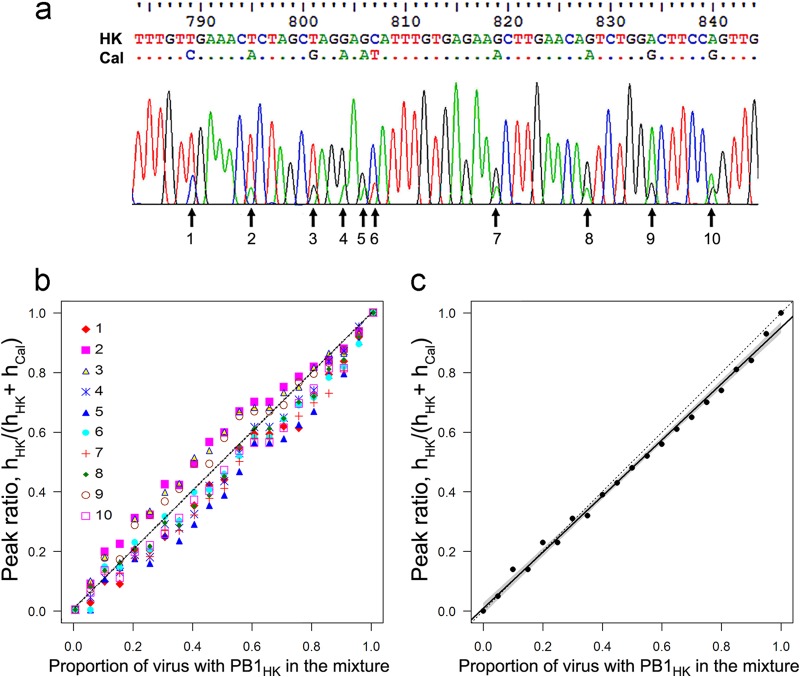
FIG 2.
Analysis of the composition of mixtures of viruses differing by PB1 gene segment. (a) Example of sequencing chromatogram of the region of the PB1 containing 10 nucleotide differences between HK and Cal. Ratios of PB1HK-specific and PB1Cal-specific peaks were calculated for each of 10 polymorphic positions (arrows) by the formula hHK/(hHK + hCal) and averaged. (b and c) Dose-response patterns generated using standard mixtures of viruses Cal-HAHK and Cal-(HA+PB1)HK. Panel b illustrates the variation of peak ratios for individual polymorphic positions. The dotted line indicates the identity line. Panel c shows the dose-response curve obtained by averaging peak ratios for all positions. The thick line depicts the linear regression line with a 95% confidence band (gray).

