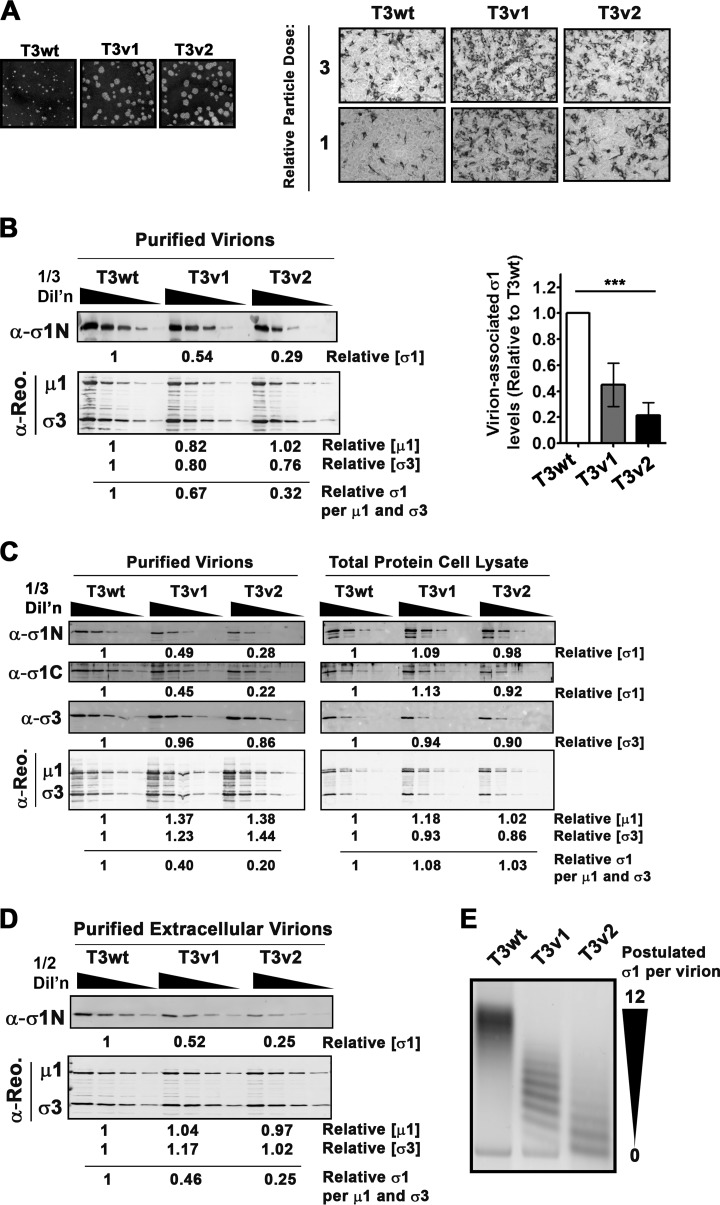
FIG 1.
Reovirus variants T3v1 and T3v2 have reduced levels of σ1 per virion. (A, left) Comparison of plaque sizes of T3wt, T3v1, and T3v2 on L929 cells at 4 days postinfection stained with crystal violet. (Right) L929 cells were exposed to equivalent particle doses of T3wt, T3v1, and T3v2 (at 1 and 1/3 dilutions), and productively infected (dark-stained) L929 cells were visualized by immunocytochemical analysis with polyclonal antireovirus antibodies at 15 h postinfection. (B) Levels of σ1, μ1C, and σ3 in fresh CsCl gradient-purified preparations of T3wt, T3v1, and T3v2 determined by quantitative Western blot analysis. Relative protein quantities were extrapolated from polynomial equations generated from one-third dilutions of T3wt. The average number of σ1 molecules per virion was calculated as quantities of σ1/[0.5 · (μ1C + σ3)]. The graph presents average relative σ1 levels per particle for four independent preparations of T3v1 and T3v2 relative to T3wt (± standard deviations). One-way analysis of variance with Bonferroni's multiple-comparison posttest indicated that means were significantly different (***, P < 0.001). (C) Similar to panel B but with total protein lysates of L929 cells infected with T3wt, T3v1, and T3v2 or viruses purified from these lysates by high-speed centrifugation through a sucrose cushion. Antibodies to the σ1 head (C terminus) and tail (N terminus) confirm that σ1 molecules are intact. (D) Same as panel B but using extracellular virions purified from the medium of infected L929 cells. (E) Agarose gel electrophoresis of T3wt, T3v1, and T3v2 virions. The quantity of σ1 proteins per virion (0 to 12 particles) was postulated based on previously reported characterizations (36).

