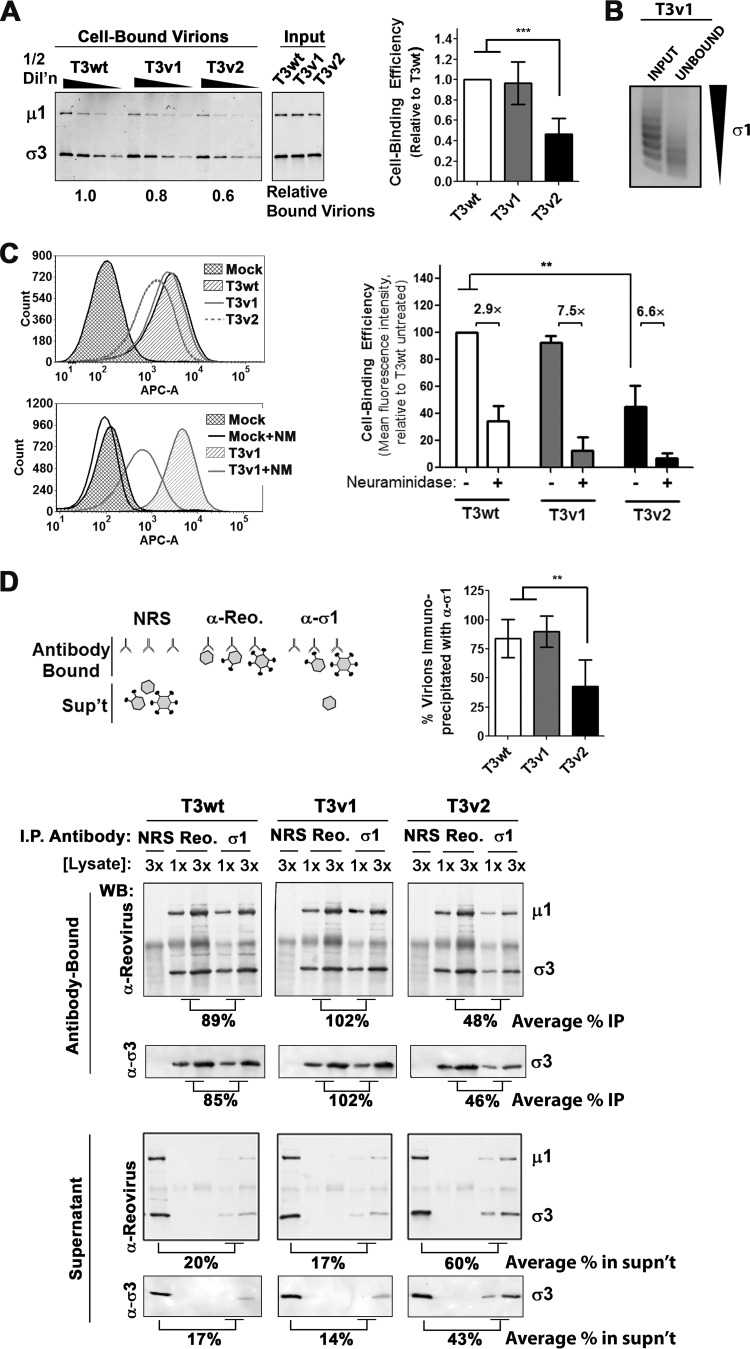
FIG 2.
T3v2 shows reduced binding to L929 cells as a result of having a proportion of virions with no σ1. (A) L929 cells were exposed to equivalent particle numbers of T3wt, T3v1, and T3v2 (at four one-half dilutions) for 1 h at 4°C. Following extensive washing, cell-bound virus was detected by Western blot analysis with antireovirus antibodies. Relative levels of bound virions were extrapolated from polynomial equations generated by T3wt protein band intensities. The histogram shows relative binding values for three independent virus preparations ± standard deviations (significant differences by one-way analysis of variance are indicated [***, P < 0.001]). (B) L929 cells were exposed to T3v1 for 1 h at 4°C. Unbound virus was pelleted at 100,000 × g for 90 min, and equivalent volumes of input and unbound virus fractions were separated by agarose gel electrophoresis. (C) Per-cell binding efficiency quantified by flow cytometry. L929 cells in suspension were either left untreated or treated with neuraminidase and then exposed to equivalent particle numbers of T3wt, T3v1, and T3v2 as described above for panel A. Cell-associated virions were detected with polyclonal antireovirus and Alexa Fluor-conjugated secondary antibodies (APC-A, fluorescence intensity in APC channel). Representative histograms for binding to untreated (top) or neuraminidase-treated (bottom) cells are shown. The bar graph summarizes per-cell binding efficiency relative to that of T3wt on untreated cells (set to 100%) (± standard deviation; n = 3; **, P < 0.01 by one-way analysis of variance). (D) Virions were immunoprecipitated (I.P.) with anti-σ1, antireovirus, or normal NRS, and antibody-bound and supernatant fractions were then subjected to Western blot analysis (WB) with antireovirus, anti-σ3, or anti-σ1, as indicated. Electrophoresis of 1 and 3 sample volumes provided data for qualitative and quantitative assessments of relative band intensities. Percent immunoprecipitation was calculated as the average intensities for reovirus bands immunoprecipitated with anti-σ1 relative to antireovirus, times 100. The histogram shows percent immunoprecipitations for three independent virus preparations (± standard deviations; **, P < 0.01 by one-way analysis of variance). Percent unbound virus represents the average intensities of reovirus bands in the supernatant following immunoprecipitation with anti-σ1 relative to NRS, times 100.

