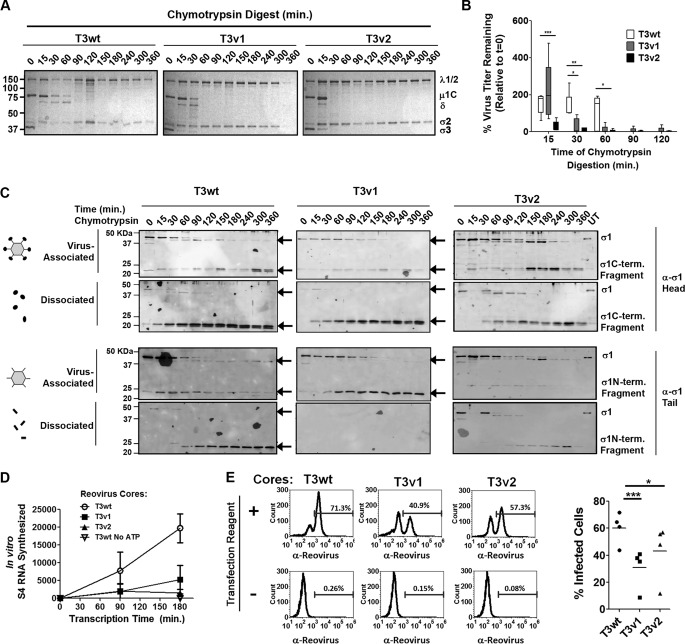
FIG 6.
Reovirus variants with reduced σ1 levels show decreased stability and infectivity under intestinal proteolysis conditions. CsCl-purified T3wt, T3v1, and T3v2 reovirus preparations were diluted to equal particle numbers based on band intensities of μ1C and σ3 during quantitative gel electrophoresis. A total of 5 × 10¹² particles/ml (estimated by the OD260) were treated with 14 μg/ml chymotrypsin for the indicated durations. (A) Degradation of σ3 and μ1C cleavage to δ, as hallmarks of reovirus outer capsid disassembly, were monitored by SDS-PAGE and Coomassie blue staining. The core proteins σ2 and λ1/2 remained intact. (B) Titers of T3v1, T3v2, and T3wt following chymotrypsin digestion were determined by plaque titration on L929 cells. The percentage of virus titers remaining after chymotrypsin digestion, relative to that in untreated samples (100%), was calculated for three independent experiments. Differences in means found to be significant by analysis of variance and Bonferroni's multiple-comparison test are indicated (*, P < 0.05; **, P < 0.01; ***, P < 0.001). (C) Cleavage and release of σ1 following chymotrypsin digestion of T3v1, T3v2, and T3wt were monitored by Western blot analysis with head- and tail-specific σ1 antibodies. Virus-associated and dissociated proteins were purified by high-speed centrifugation, as described in the legend of Fig. 3C. Results are representative of four independent experiments. (D) Cores produced at 120 min of chymotrypsin digestion (under conditions similar to those described above for panel C) were purified by high-speed centrifugation and restandardized to equal core numbers for T3wt, T3v1, and T3v2 by electrophoresis and Coomassie blue staining. Equivalent numbers of cores were then subjected to in vitro transcription reactions for 0, 90, and 180 min. Reactions were terminated with an equal volume of TRIzol spiked with GFP mRNA, to permit normalization following RNA extraction and cDNA synthesis. Levels of reovirus S4 relative to GFP RNA levels were monitored by quantitative reverse transcription-PCR and are presented as means ± standard deviations (n = 3 for T3wt and T3v1; n = 2 for T3v2). One-way analysis of variance with Bonferroni's multiple-comparison test indicates significant differences between T3wt and T3v1 (P < 0.05) and between T3wt and T3v2 (P < 0.01) at 180 min. Transcription reaction mixtures with T3wt cores in the absence of ATP served as negative controls. (E, left) Equal numbers of T3wt, T3v1, and T3v2 (as described above for panel D) were added to H1299 cells in the presence or absence of the transfection reagent Lipofectamine 2000. At 15 h p.i., cells were paraformaldehyde fixed and stained with reovirus-specific antibodies. The proportion of cells positive for reovirus protein expression by flow cytometry is indicated. (Right) Percent infection by cores in the presence of the transfection reagent for two independent experiments, with two core-to-Lipofectamine 2000 ratios per experiment. Significant differences in means (line) determined by analysis of variance and Bonferroni's multiple-comparison test are indicated.

