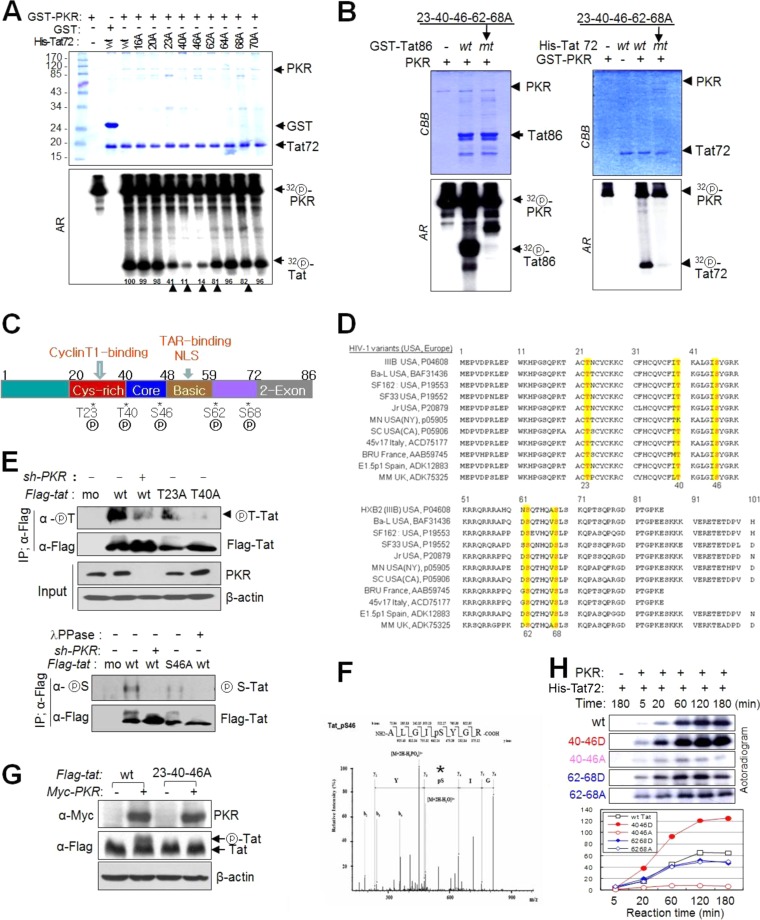
FIG 4.
PKR phosphorylates HIV-1 Tat on five different Ser/Thr residues. (A) wt and 9 mt Tat72 proteins were incubated with preactivated PKR in the presence of [γ-32P]ATP. The reaction products were separated on a 12% SDS-polyacrylamide gel (upper panel) and assessed by autoradiography (lower panel). Phosphor-Tat bands were quantified using TINA 2.0 software (Raytest, Straubenhardt, Germany) and represented by the percentage of the relative intensity of each band. Arrowheads indicate postulated PKR-mediated Tat phosphorylation sites. (B) GST-attached wt and mt (5 Ala substitutions at positions 23, 40, 46, 62, and 68) Tat86 (left) and Tat72 (right) proteins were incubated with preactivated PKR, Tat phosphorylation was assessed by autoradiography following SDS-PAGE. (C) PKR-mediated phosphorylation sites on the functional domain of HIV-1 (HXB2) Tat. (D) Amino acid sequences of the Tat proteins of typical HIV-1 variants in the United States and Europe (see Table S4 in the supplemental material). Five PKR target Ser/Thr sites are indicated by yellow boxes. (E) PKR-normal or PKRKD HEK293 cells were transfected with Flag-tagged wt (86 aa) and single mt Tat plasmids. Cell extracts were immunoprecipitated with anti-Flag antibody and then assessed by Western blotting with phospho-Thr (upper panel)- and phospho-Ser (lower panel)-specific antibodies. (F) ESI-MS/MS of tryptic peptides of Tat. The assigned spectrum matched the given phosphopeptide sequence corresponding to residues 42 to 49 of HIV-1 Tat (ALGIpSYGR, m/z). *, phosphorylation site on the peptide. (G) HEK293T cells were cotransfected with Flag-tagged wt and 23-40-46A triple mt Tat86-expressing plasmids and PKR-expressing (Myc-PKR) plasmids. Samples were assessed by Western blotting with anti-Flag and anti-Myc antibodies. (H) His-tagged wt and double mt (S/T-to-D/A substitutions) Tat72 proteins were incubated with preactivated PKR (GST-PKR) for the indicated periods of time. Reaction products were assessed by autoradiography after SDS-PAGE (left). The relative band intensity of each sample is presented in a histogram (right).

