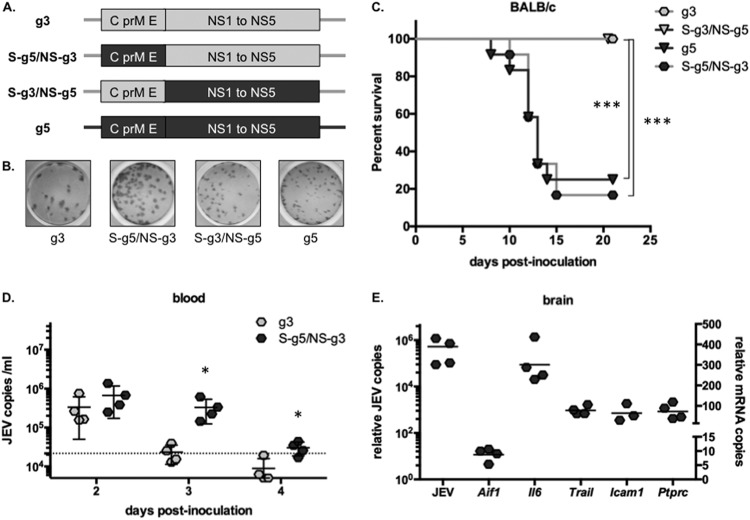
FIG 7.
The use of chimeric viruses links JEV g5 structural genes to pathogenicity in BALB/c mice. (A) Schematic representation of the genomic RNA of JEV g3 (light gray) and g5 (dark gray) and of the chimeric viruses JEV S-g5/NS-g3 and S-g3/NS-g5, which express most of the structural proteins (C, prM, and E [amino acids 1 to 472]) of one genotype, fused to part of the E protein (amino acids 473 to 500) and the nonstructural proteins (NS1 to NS5) of the other. (B) Example of infectious foci developed for JEV g3, g5, S-g5/NS-g3, and S-g3/NS-g5 after FFA in BHK-21 cells. (C) Groups of 3-week-old BALB/c mice (n = 12 per group) were monitored for survival after intraperitoneal (IP) injection with 103 FFU of JEV g3, g5, S-g5/NS-g3, or S-g3/NS-g5. Results from a representative experiment (n > 2 repeats) are shown. Asterisks indicate that the differences between survival curves are statistically significant using the log rank (Mantel-Cox) test (***, P < 0.001; **, 0.001 < P < 0.01; *, 0.01 < P < 0.05; ns, not significant, P > 0.05). (D) Total blood was collected from mice inoculated with 103 FFU of JEV g3 or S-g5/NS-g3 at 2, 3, and 4 days postinfection, and total RNA was extracted. JEV RNA was quantified by RT-qPCR, and the limit of detection of the assay, corresponding to values obtained from mice injected with DPBS, is shown as a dotted line. Each sign represents an individual mouse, and results from a representative experiment (n = 2 repeats) is shown. Asterisks indicate that the differences between experimental samples are statistically significant at each time point using the unpaired t test (***, P < 0.001; **, 0.001 < P < 0.01; *, 0.01 < P < 0.05; not significant, P > 0.05). (E) Brains were collected from mice inoculated with 103 FFU of JEV S-g5/NS-g3 at 9 days postinfection. Total RNA was extracted, and JEV RNA (plotted on the left y axis) and mRNA for AIF-1, IL-6, TRAIL, ICAM-1, and CD45 (plotted on the right y axis) were quantified by RT-qPCR. The results were normalized to HPRT mRNA and are expressed as the relative fold increase over RNA from DPBS-infected controls. Each symbol represents an individual mouse, and results from a representative experiment (n = 3 repeats) are shown.

