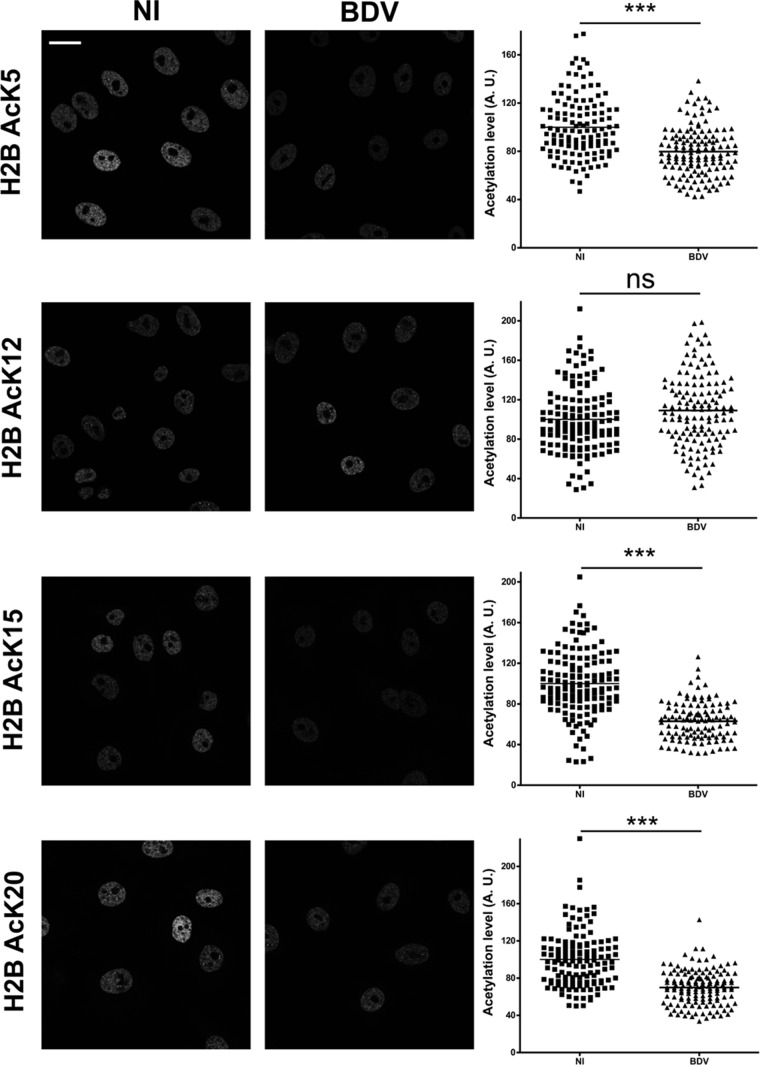
FIG 3.
Histone acetylation decrease due to BDV affects all infected cells. Immunofluorescence analysis was performed on noninfected (NI, left column) or persistently infected (BDV, right column) Vero cells, in order to visualize acetylation on H2B lysine residues, as indicated on the left of the figure. Bar = 25 μm. Fluorescence quantification is presented to the right of each corresponding image. The mean signal density per nucleus is expressed in arbitrary units (A. U.), and each spot corresponds to one nucleus. Analysis data represent the sum of the results from three cultures of Vero cells that were independently grown after the original split during 5 to 20 passages, with more than 100 cells being analyzed for each condition. ***, P ≤ 0.0001; ns = nonsignificant (by Mann-Whitney test).

