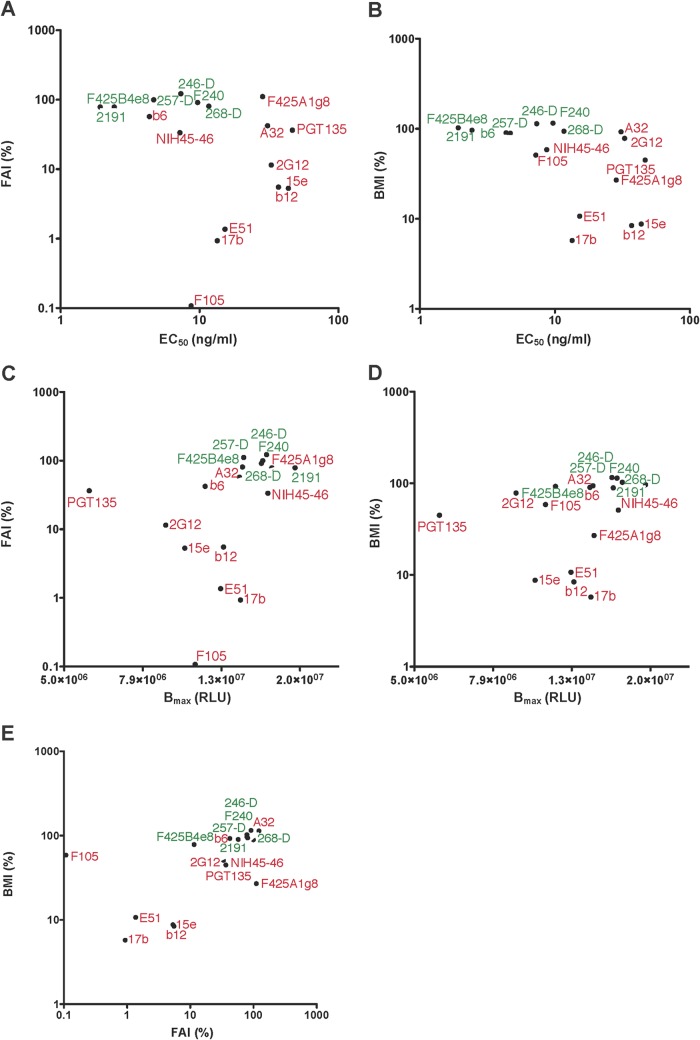
FIG 3.
Resistance of binding to the chaotrope does not correlate well with MAb affinity. EC50 and Bmax values were calculated by fitting a sigmoid function to the data shown in Fig. 1 and 2A and B. The functional affinity index (FAI) and the Bmax index (BMI) are two different measurements of the resistance to chaotrope treatment of MAb binding to the Env Ag. FAI (%) was plotted against EC50 (ng/ml) (A), BMI (%) against EC50 (ng/ml) (B), FAI (%) against Bmax (RLU) (C), BMI (%) against Bmax (RLU) (D), and FAI (%) against BMI (%) (E). Symbols representing Abs targeting the more continuous epitopes (V3 and gp41) and the more composite epitopes are labeled in green and red, respectively.

