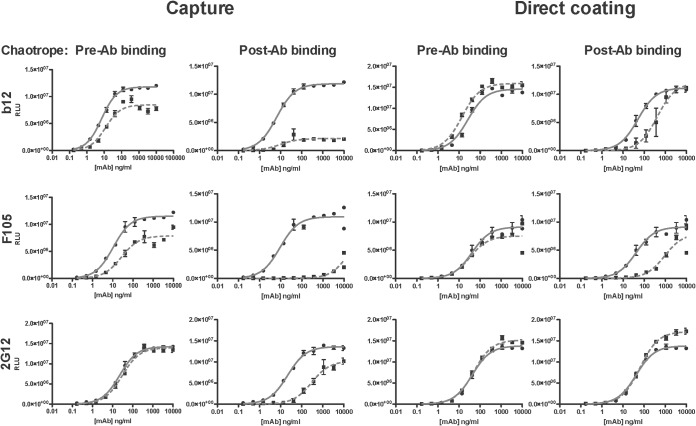
FIG 4.
Antigenic perturbation by the chaotrope contributes to reduced binding of MAbs to gp120. The plots on the left show MAb binding to gp120 in capture ELISA, and those on the right show the binding in the direct-coating ELISA, as indicated. For each type of assay, the results of the pre- and post-Ab-binding chaotrope (NaSCN) treatments are shown under the respective labels in the left and right columns (the ELISA conditions for the post-MAb-binding condition in the capture assay were like those in the experiments whose results are shown in Fig. 1.) In each assay, luminescence (RLU) is expressed on the y axis as a function of MAb concentration (ng/ml) on the x axis. The MAb binding after chaotrope or control (PBS) treatment is represented by dashed and solid lines, respectively. The data points are the mean results from three intra-assay replicates, and the error bars show the SEM. Each plot is representative of ≥2 replicate experiments.

