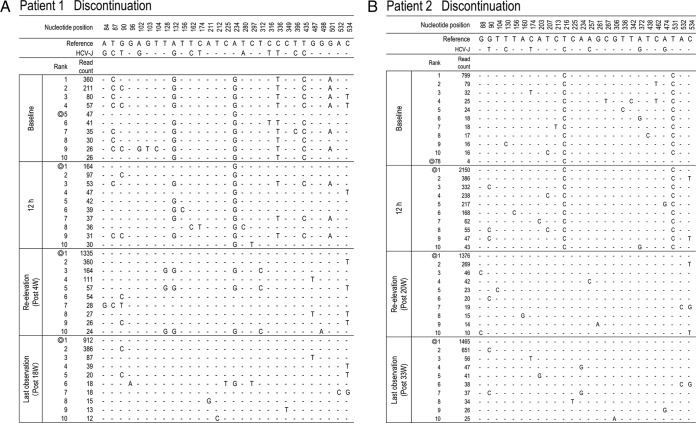
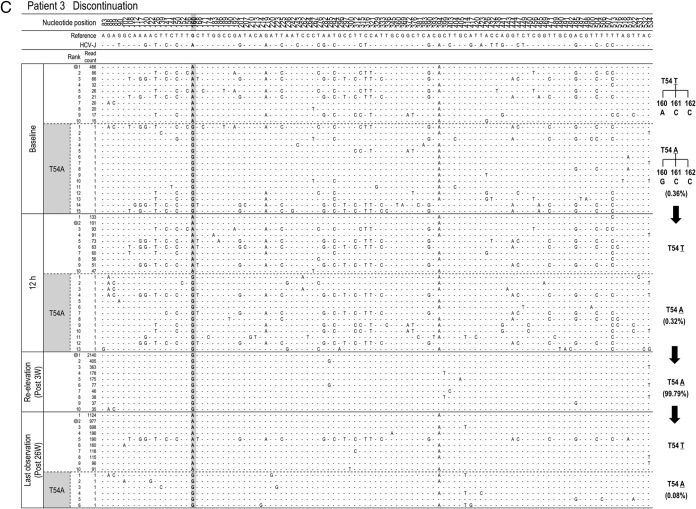
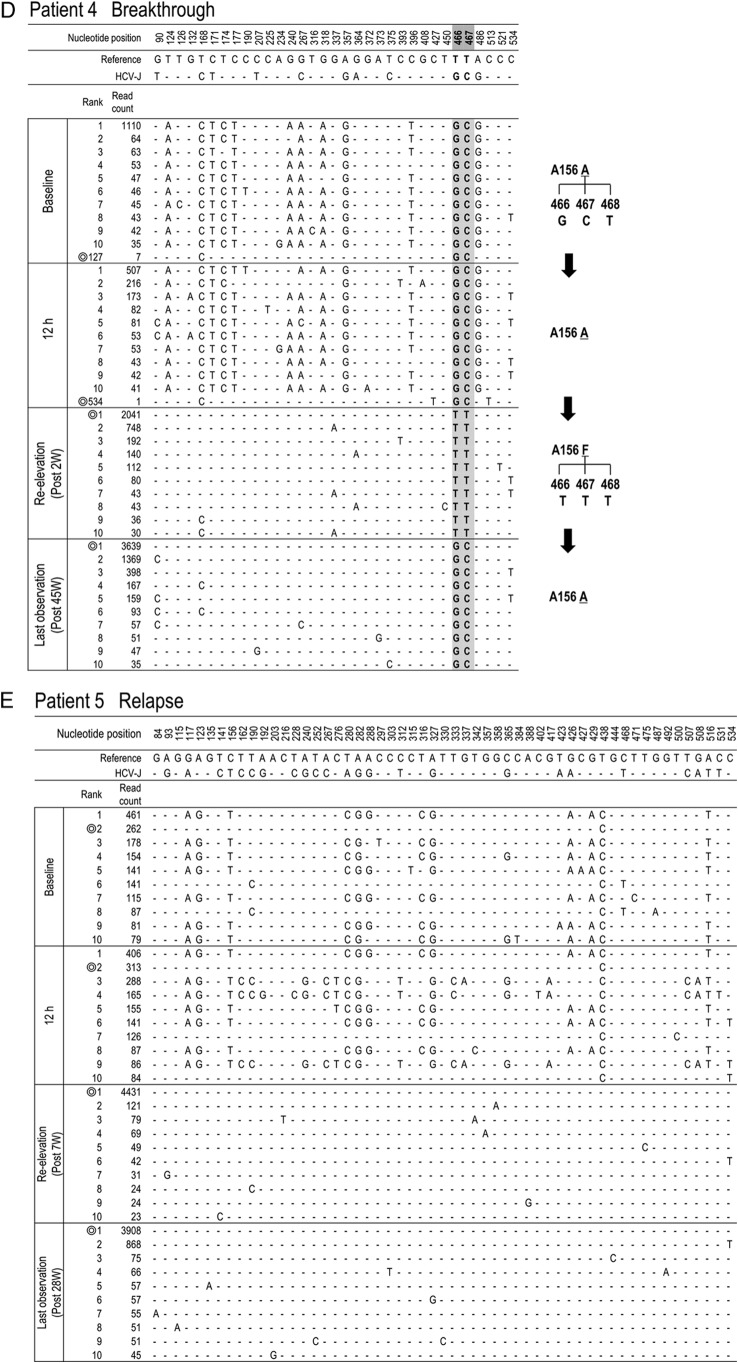
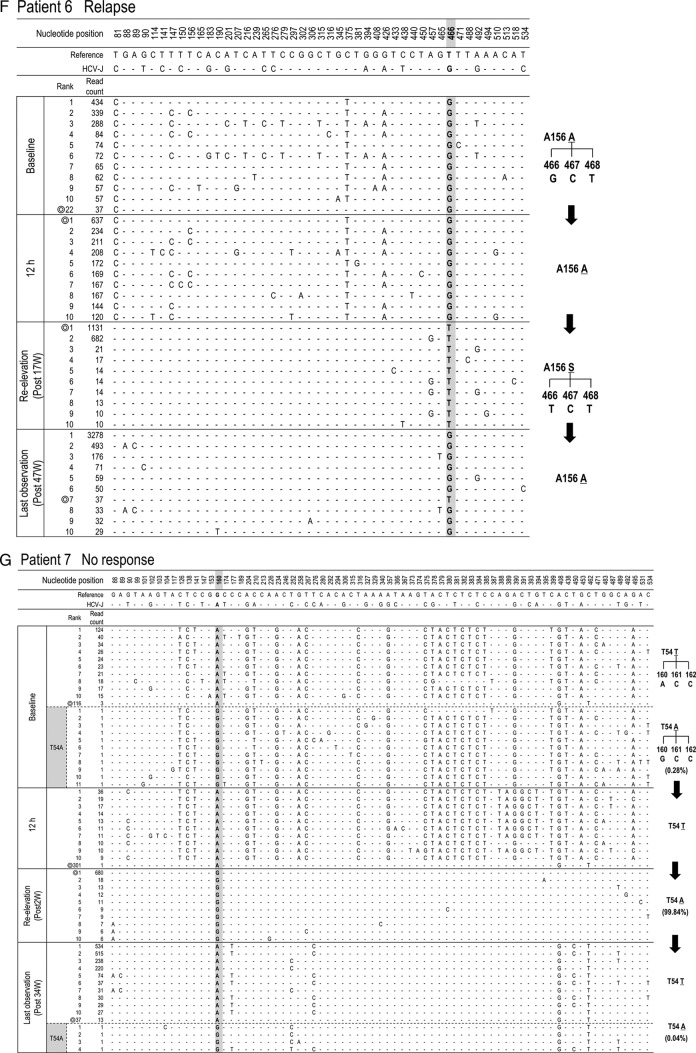
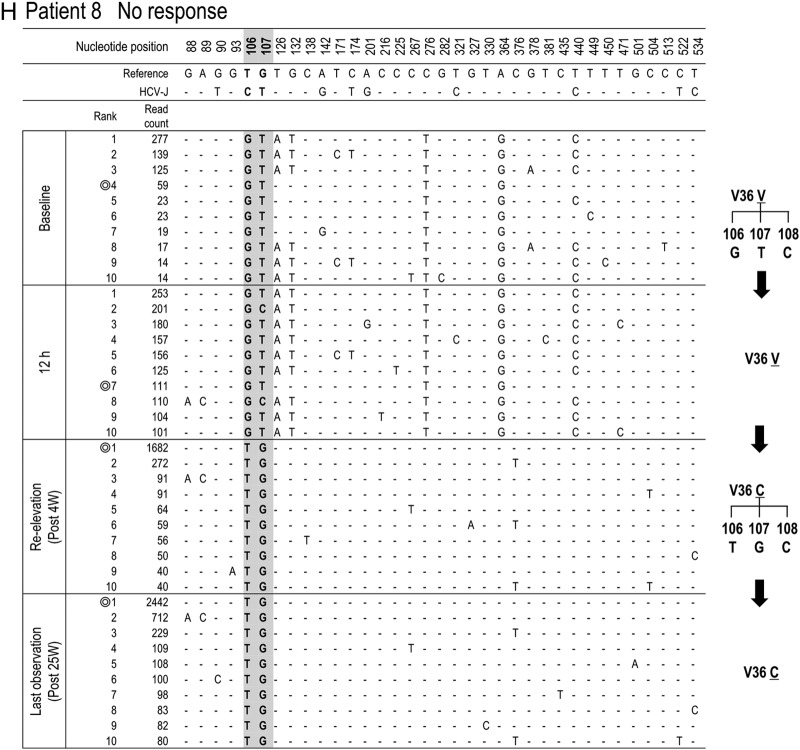
FIG 4.
Time-dependent changes in the top 10 most populated isolates at baseline, 12 h, reelevation, and last observation in each patient. To characterize viral sequences specific for each time point, only nucleotide positions with time-dependent nucleotide changes are shown. The most frequent isolate at reelevation was used as the reference sequence. Nucleotide positions in the figure indicate the nucleotide positions from the start nucleotide in genotype 1b NS3. An isolate closest to the most frequent isolate found at reelevation is indicated by the double ring for each time point. In patients with the appearance of resistance mutations, time courses in the changes of hot spot nucleotides and resultant changes in amino acids are demonstrated at the right (C, D, F, G, and H).

