FIG 3.
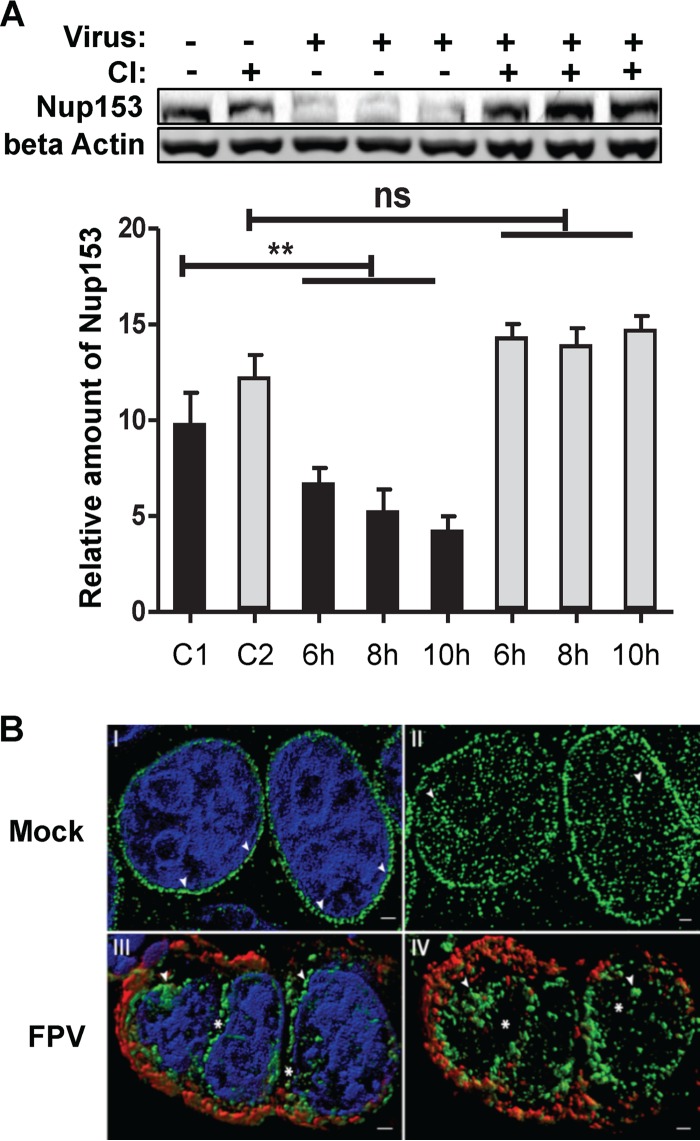
Caspase-dependent Nup153 degradation and redistribution in IV-infected cells. (A) MDCK-II cells were mock infected (C1 and C2) or infected with FPV (MOI = 3) in the presence (gray bars) or absence (black bars) of caspase inhibitor (CI). Intracellular amounts of Nup153 and beta actin were determined by Western blotting, and the amount of Nup153 was quantified in relation to the amount of beta actin (control) at the indicated time points p.i. Column sizes represent relative Nup153 amounts normalized to the amount of beta actin. Experiments were done in triplicate. (C1, noninfected and nontreated control; C2, noninfected and CI-treated control). Significance levels are indicated (n.s., no significant difference; **, P = 0.03). (B) Superresolution microscopy reveals IV-induced aggregation and delocalization of nuclear pore complexes. MDCK-II cells were either mock infected (panels I and II) or infected with FPV (MOI = 0.01) (panels III and IV) for 24 h. MAbs against IV nucleoprotein (red) and Nup153 (green) were used. DNA was counterstained with DAPI (blue). Panels I and III show a surface-rendered 3D projection of five Z-planes acquired from the nuclear center to demonstrate the regular distribution (arrowheads) of NPCs in mock-infected cells (panel I) and aggregation (arrowheads) as well as delocalization (gaps indicated by asterisks) of NPCs in IV-infected cells (panel III). Panels II and IV show projections of the upper halves of the nucleus of mock-treated (panel II) and infected (panel IV) cells without DNA staining. Scale bar, 1 μm.

