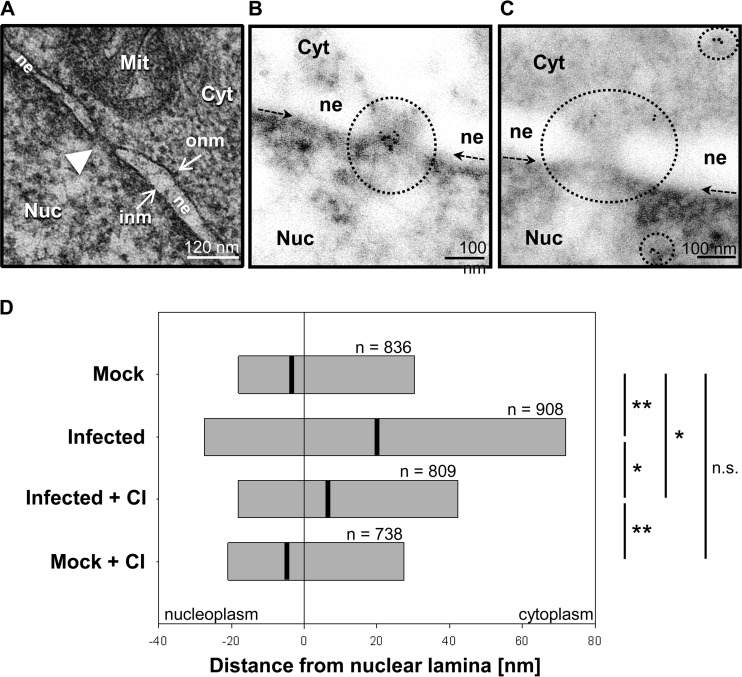
FIG 5.
Transmission electron microscopy and immunogold labeling. (A) Ultrastructural image of a nuclear pore (white arrowhead) in MDCK-II cells. The nuclear envelope is formed by the outer nuclear membrane (onm) and the inner nuclear membrane (inm). Cyt, cytoplasm; Nuc, nucleoplasm; Mit, mitochondrion; ne, nuclear envelope. (B and C) Typical TEM images after immunogold labeling for Nup153 in noninfected (B) and FPV-infected (C) MDCK-II cells. Circles highlight labeled areas, and arrows indicate the position of the nuclear lamina just above the strongly contrasted heterochromatin. The nuclear ne is seen as an area with reduced electron density, whereas the inm and onm are not visible due to the omission of osmium treatment (see protocol). (D) Spatial distribution of distances between Nup153 signals and the nuclear lamina. Bars represent the central 50% (interquartile range) of ranked data of each group. Black lines indicate median values. Significance levels are indicated (n.s., no significant difference; *, P ≤ 0.004; **, P ≤ 0.002). In each test group, immunogold data were collected from two experiments and 10 different cell profiles, except in test group Mock + CI, for which data were collected from two experiments and 6 cell profiles.

