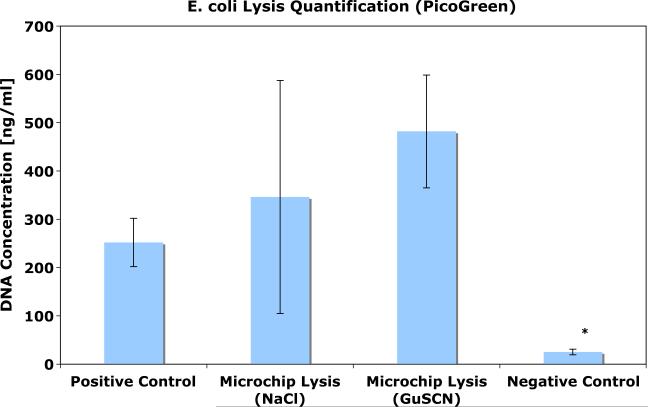
Fig. 3.
Summary of lysis quantification experiments. DNA concentration was measured after samples were run over a column in the presence of both low and high salt buffer solutions. The positive control is the Qiagen kit. The negative control is a sample mixed with NaCl buffer and left on the bench for the duration of the experiment. The experimental samples and the negative controls were gently filtered (0.2 μm filter) and ethanol precipitated to remove any fluorescent cell debris prior to fluorescent quantification. *p<0.001

