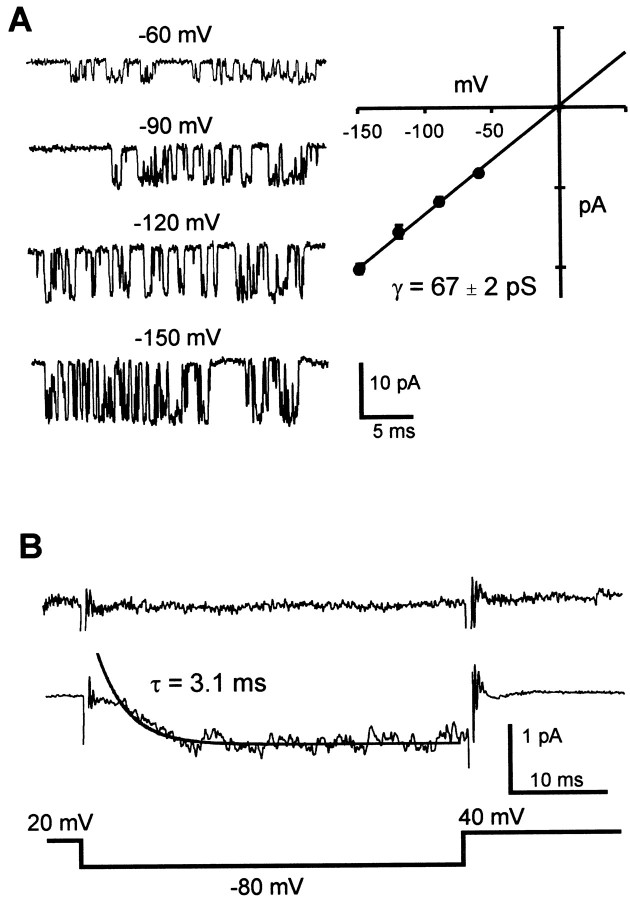
Fig. 7.
Single-channel currents from EXP-2 channels. Single-channel activity was recorded during recovery from inactivation with 100 mm KCl in the recording pipette. Channel activation and inactivation were induced by a 1 sec prepulse to 20 mV.A, The voltage for recovery was varied from −60 to −150 mV. Representative traces at all test voltages are shown in the left panel. The right panelshows the I–V relationship for single EXP-2 channels (5 different patches). Regression analysis yields a single-channel conductance of 67 ± 2 pS. B, Ensemble average currents for EXP-2 channels. Top trace (no prepulse) shows the average of 20 traces when the activation–inactivation prepulse to 20 mV was reduced to 4 msec. The middle trace shows the average of 200 traces and the superimposed single-exponential fit with a time constant of 3.1 msec. Thebottom trace depicts the voltage protocol during sampling. Capacitive and leakage components were obtained from a multiexponential fit to the average of 10 traces with no openings. The idealized trace was then subtracted from each individual trace before averaging. The remaining frequency transients were blanked.

