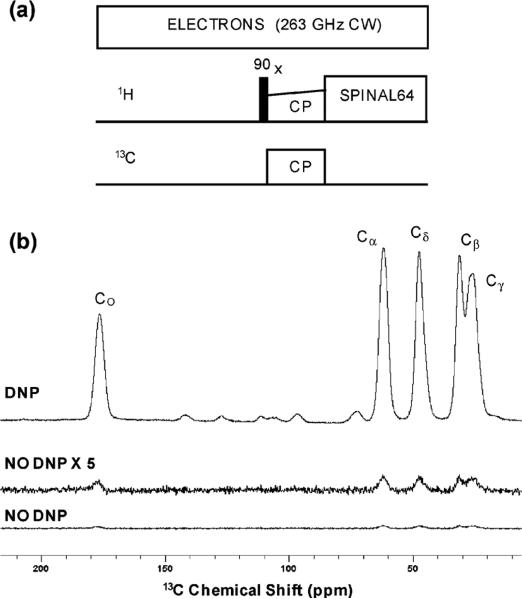
Fig. 5.
(a) DNP CPMAS pulse sequence; (b) spectra of 0.5 M U- 13C, 15N-proline in glycerol-d8–D2O–H2O (60 : 30 : 10 volume ratio) and 15 mM TOTAPOL biradical, 25 μl sample volume, with DNP (top trace) and without DNP (bottom traces). Spectra acquired at ωr/2π = 8 kHz MAS, 95 K sample temperature, 4 scans, 2 s recycle delay, and one dummy scan. Higher numbers of scans were also acquired with microwaves off for more accurate DNP signal enhancement calculation.

