Fig. 7.
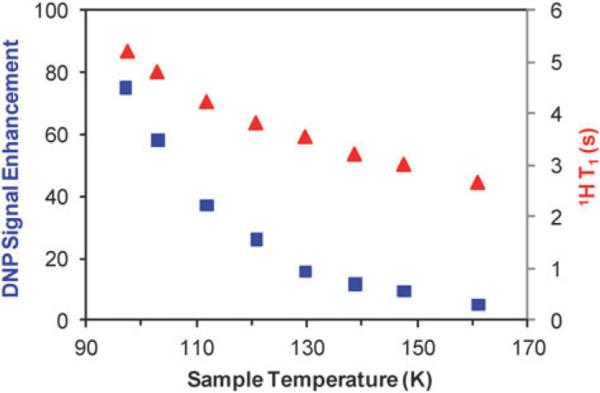
Temperature dependence of the 1H DNP signal enhancement (blue squares) and 1H spin lattice relaxation times, T1, (red triangles) measured on 2 M 13C urea in glycerol-d8–D2O–H2O (60 : 30 : 10 volume ratio) with 15 mM TOTAPOL biradical. 13C CPMAS experiments with 4 scans, 10 s recycle delay, 2 dummy scans, ωr/2π = 6.2 kHz. Each temperature point was measured with microwaves on and off for calculation of the DNP signal enhancement. 1H T1 was measured with 1H saturation recovery with CP detection, 11 points and 2 scans per point. Standard deviation was less 1 × 10⁻² on the calculated T1 values. Error bars on the DNP signal enhancements are ±2%. The sample temperature corresponds to calibrated temperature with the microwaves off.

