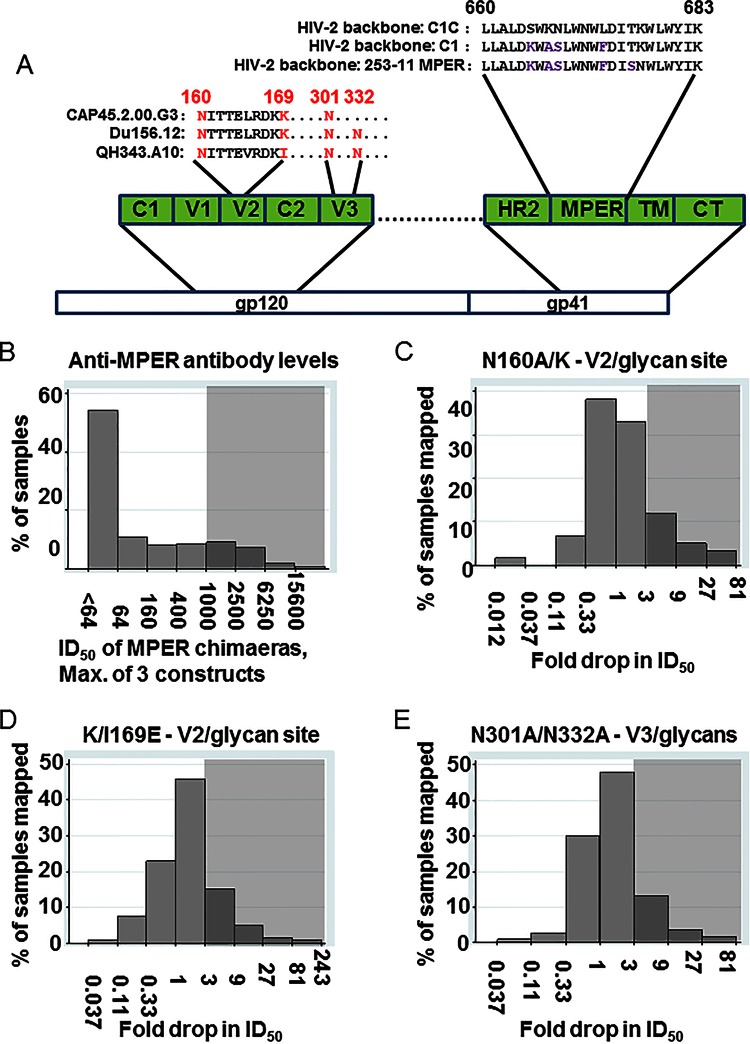
FIG 3.
Mapping of anti-MPER, anti-V2/glycan site, and anti-V3/glycan antibodies in the cohort sera. (A) A depiction of the location of the MPER and the MPER sequences inserted into the HIV-2/HIV-1 MPER chimeric viruses and of the location of the mutations used for mapping the V2/glycan site and V3/glycan epitopes. C, constant region; V, variable loop; HR, heptad repeat; TM, transmembrane domain; CT, cytoplasmic tail. (B) The distribution of anti-MPER ID50 (log scale) is shown, using the highest of the three ID50 values obtained against the three HIV-2/HIV-1 MPER chimeric viruses. Gray shading indicates at what level samples were scored positive for anti-MPER antibodies (ID50 > 1,000). (C, D, and E) The distribution of drops in neutralization due to the introduction of the N160A/K (C), K/I169E (D), or N301A/N332A (E) mutation compared to the unmutated parent virus. Gray shading indicates at what level samples were scored positive for the indicated mapping mutant (≥3-fold drop compared to unmutated parent virus). If mapping of more than one virus was measured, the maximum fold drop is shown, except when the maximum was less than 3 and the minimum was less than 1; minimum fold drop is shown in order to display presumed masking of neutralization epitopes by glycans. Values below 1 indicate an increase in neutralization of the mutant virus compared to the parent.

