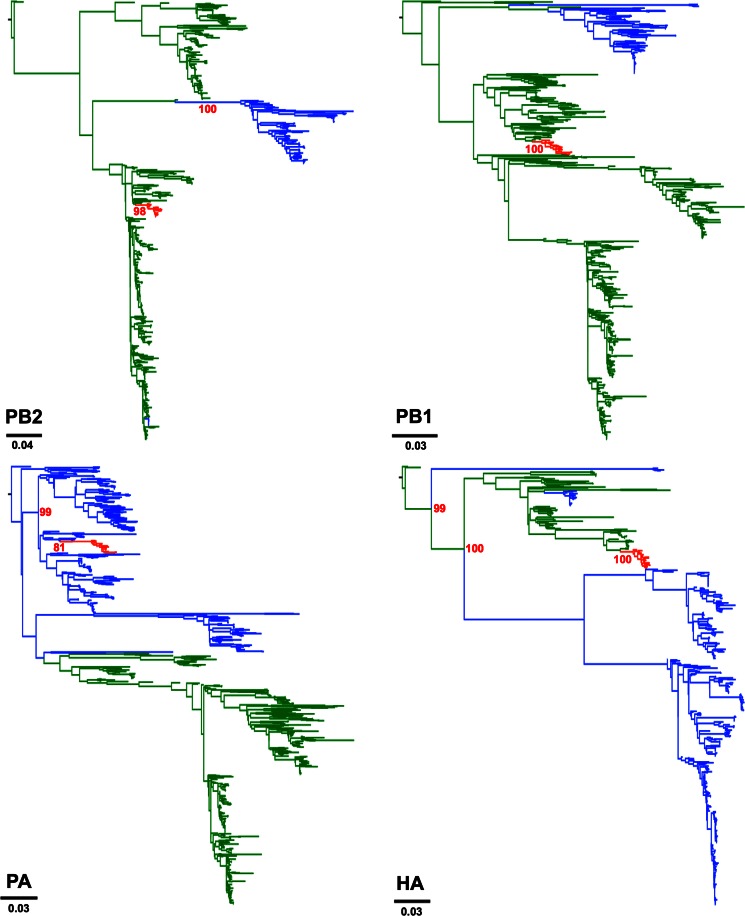
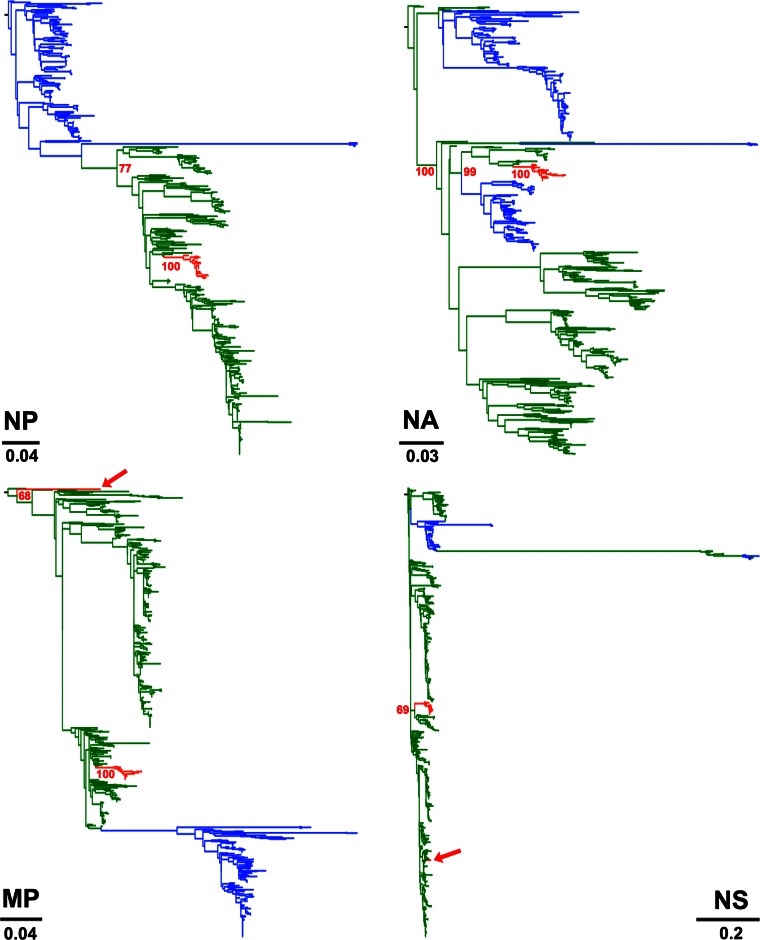
FIG 1.
Origin of H3N2 CIV. Maximum likelihood trees using an expanded subset derived from a phylogeny comprising 877 IAV sequences representing 14,764 IAV genomes. Colored branches represent distinct lineages as follows. The H3N2 CIV lineage is shown in red, Eurasian avian viruses are shown green, and American avian viruses are shown in blue. Bootstrap values of relevant branches are shown. Arrows indicate gene segments of H3N2 CIV that resulted from heterosubtypic reassortment. The bars are drawn to scale.


