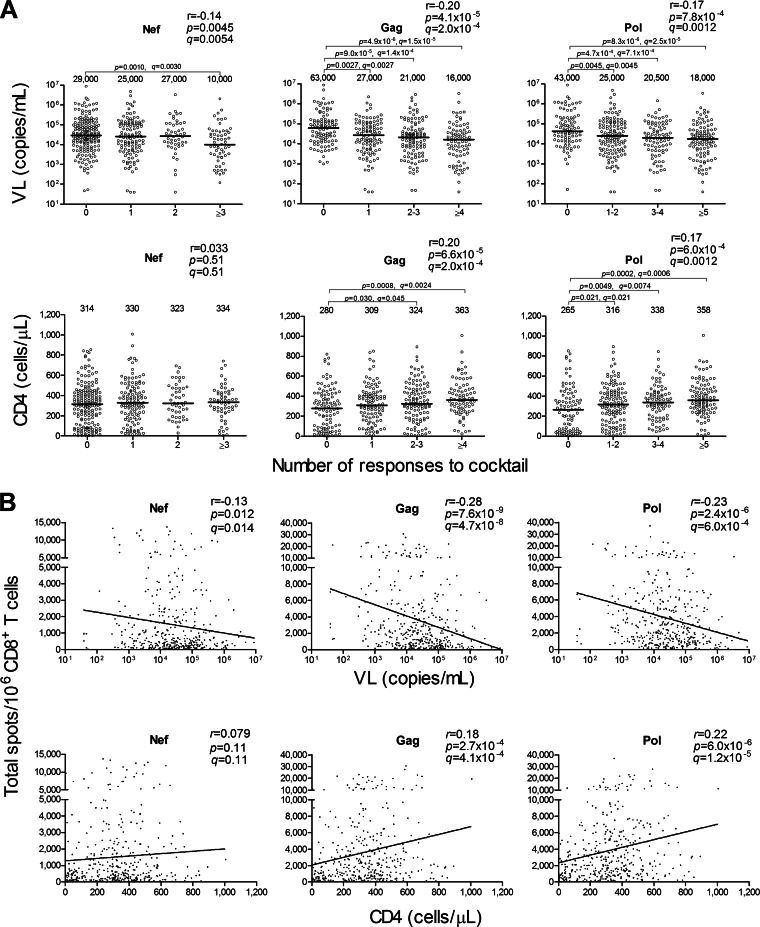
FIG 1.
Correlation between CTL responses to HIV-1 peptide cocktails and pVL or CD4 count. The CD8+ T cell responses to 10 Nef, 25 Gag, and 50 Pol peptide cocktails including 10 11-mer single overlapping HIV-1 clade B peptides at a concentration of 1 μM in 401 chronically HIV-1-infected Japanese individuals were analyzed by using the ELISPOT assay. (A) Correlation between breadths of the CD8+ T cell responses to the peptide cocktails and pVL or CD4 count. The breadth was evaluated by calculating the number of cocktails recognized by the specific CD8+ T cells. The values and the lines in each graph represent medians of pVL and CD4 count (top and bottom, respectively). Statistical analysis was performed by use of Pearson's correlation coefficient test. Differences in pVL or CD4 count between nonresponders and responders were statistically analyzed by using the Mann-Whitney test. (B) Correlation between total magnitudes of the responses to the cocktails and pVL or CD4 count. The total magnitude was evaluated by calculating total spot numbers in the responses to Nef, Gag, or Pol peptide cocktails. Correlation coefficients (r) and P values were determined by using the Spearman rank correlation test. The line is the regression line. Multiple tests were performed by using the q value, a measure of significance in terms of the false-discovery rate (46). A significance threshold for q of <0.2 was employed. Each dot represents 1 individual. The limit of detection for pVL in this study is <40.

