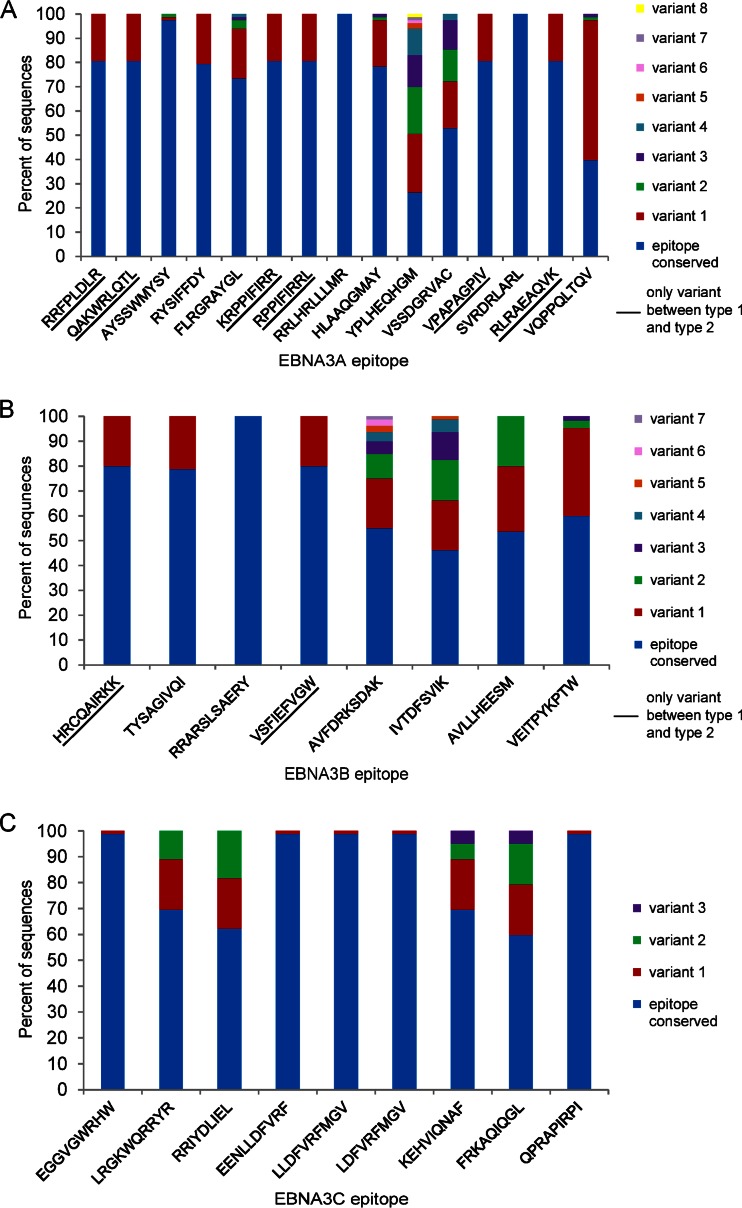
FIG 3.
Variation in T-cell epitopes in EBNA3 genes. Variation in known T-cell epitopes in EBNA3A (A), EBNA3B (B) and EBNA3C (C) genes across all 83 EBV genomes. Graphs indicate the percentage of EBV genome sequences with the epitope fully conserved (blue) and the percentage of sequences that have each of the variant sequences as a stacked histogram. Some epitopes are fully conserved across all strains (fully blue bars), some have differences only between type 1 and type 2 (underlined), and some have multiple variants. Only sequences with an intact open reading frame were included.

