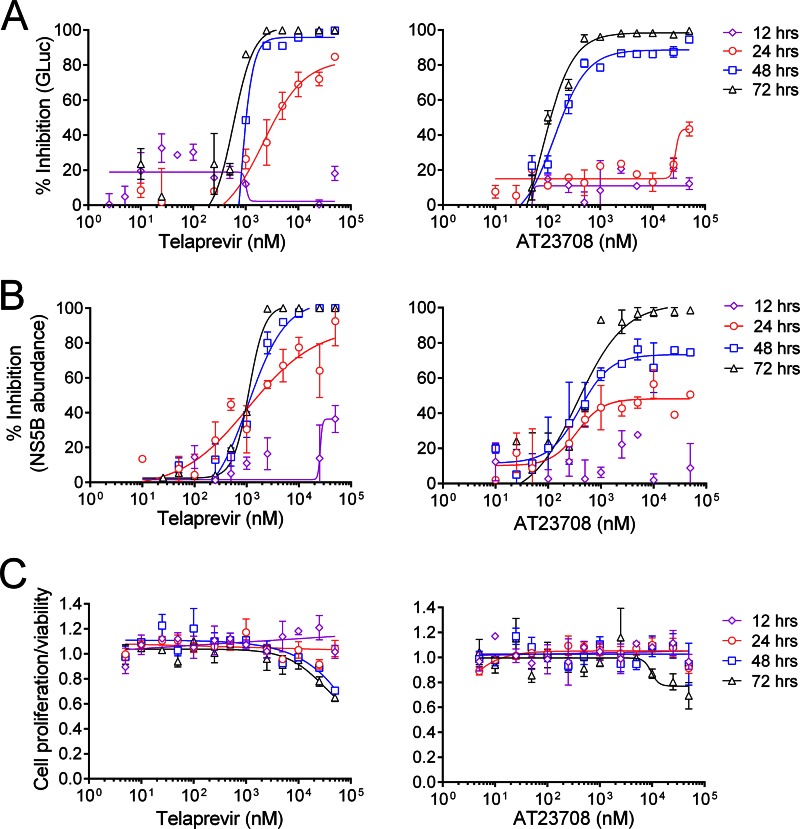
FIG 1.
(A) Kinetic analysis of the suppression of H77S.3/GLuc2A virus replication by the active-site protease inhibitor telaprevir or the allosteric NS3 inhibitor AT23708. Huh7 cells were electroporated with H77S.3/GLuc2A RNA genomes and passaged for 1 week before they were challenged with an inhibitor over a range of concentrations. At 12, 24, 48, and 72 h following addition of inhibitor, the cell culture media were harvested and replaced with fresh medium containing inhibitor. The percent inhibition of GLuc activity in cell culture medium is plotted on the y axis, where 0% is the GLuc activity in cells treated with medium containing DMSO vehicle only (no inhibitor) and 100% inhibition is a reduction of GLuc activity to background levels (determined by measurement of GLuc activity in medium from cells transfected with a replication-incompetent RNA genome, H77S-AAG/GLuc2A). The data shown represent the mean ± SEM from 3 replicates of an experiment representative of multiple experiments. Data were fit to dose-response curves as described in Materials and Methods. EC50 and EC90 values for telaprevir and AT23708 in the GLuc assay are shown in Table 1. (B) Reduction of intracellular NS5B abundance following addition of telaprevir or AT23708 to Huh7 cells infected with H77S.3. NS5B and β-actin were detected in cell lysates by Western blotting. NS5B levels were normalized using β-actin as a loading control. Normalized NS5B abundance was expressed as percent inhibition, where 0% is the NS5B abundance in cells treated with the DMSO vehicle only and 100% inhibition is a reduction of NS5B levels to background levels (determined using lysates from uninfected cells). The data shown represent the mean ± SEM percent inhibition from 3 independent experiments. EC50 and EC90 values for telaprevir and AT23708 in the Western blot analyses are shown in Table 3. (C) Effect of telaprevir and AT23708 on cell proliferation and viability measured by a WST-1 cell proliferation assay. The data shown are normalized to the values obtained from cells grown in medium containing 0.1% DMSO vehicle and represent the mean ± SEM from 3 independent experiments.

