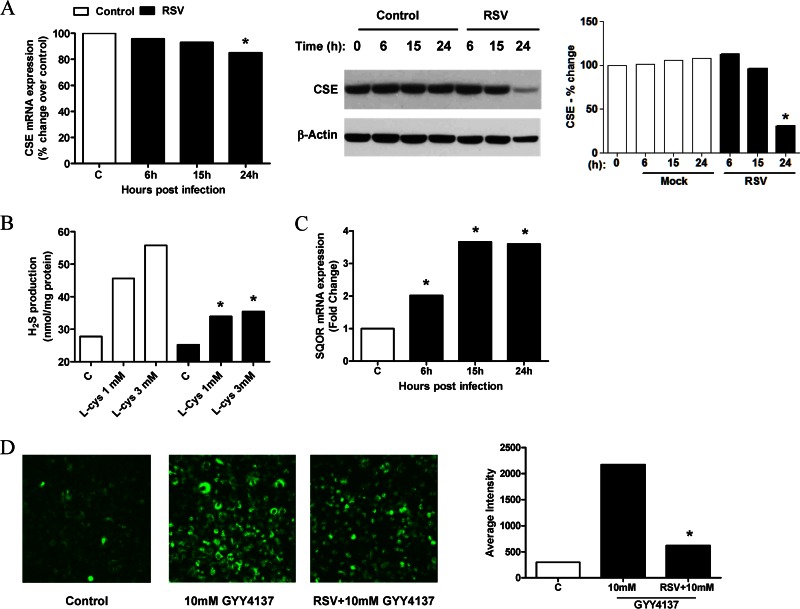
FIG 1.
Effect of RSV infection on H2S production in airway epithelial cells. A549 cells were infected with RSV for 6, 15, and 24 h and harvested to prepare total RNA or total cell lysates. (A and C) CSE (A, left) and SQOR (C) mRNA levels in uninfected and RSV-infected cells were measured by reverse transcriptase quantitative PCR (qRT-PCR). CSE cellular levels were also measured by Western blotting of total cell lysates. The membrane was stripped and reprobed for β-actin to determine equal loading of the samples (A, middle). Densitometric analysis of CSE band intensity, normalized to β-actin, was performed by using Alpha Ease software version 2200 (2.2d) (Alpha Innotech Co., San Leandro, CA) (A, right). Results are representative of data from three independent experiments. *, P < 0.05 compared to uninfected cells. (B) A549 cells were infected with RSV for 15 h and harvested to prepare total cell lysates. H2S production in uninfected and RSV-infected cells was determined by a methylene blue colorimetric assay. Results are representative of data from three independent experiments. *, P < 0.05 compared to uninfected cells. (D) A549 cells were incubated with 5 μM the fluorescent probe SF7-AM and infected with RSV for 1 h. Medium or 10 mM GYY4137 was added to uninfected or infected cells and incubated for 15 h. (Left) Images of uninfected and untreated cells (control) and uninfected or infected cells treated with 10 mM GYY4137. (Right) Average fluorescence intensity quantified by confocal microscopy using Zeiss Metamorph software. Results are representative of data from three independent experiments. *, P < 0.05 compared to uninfected, treated cells.

