FIG 1.
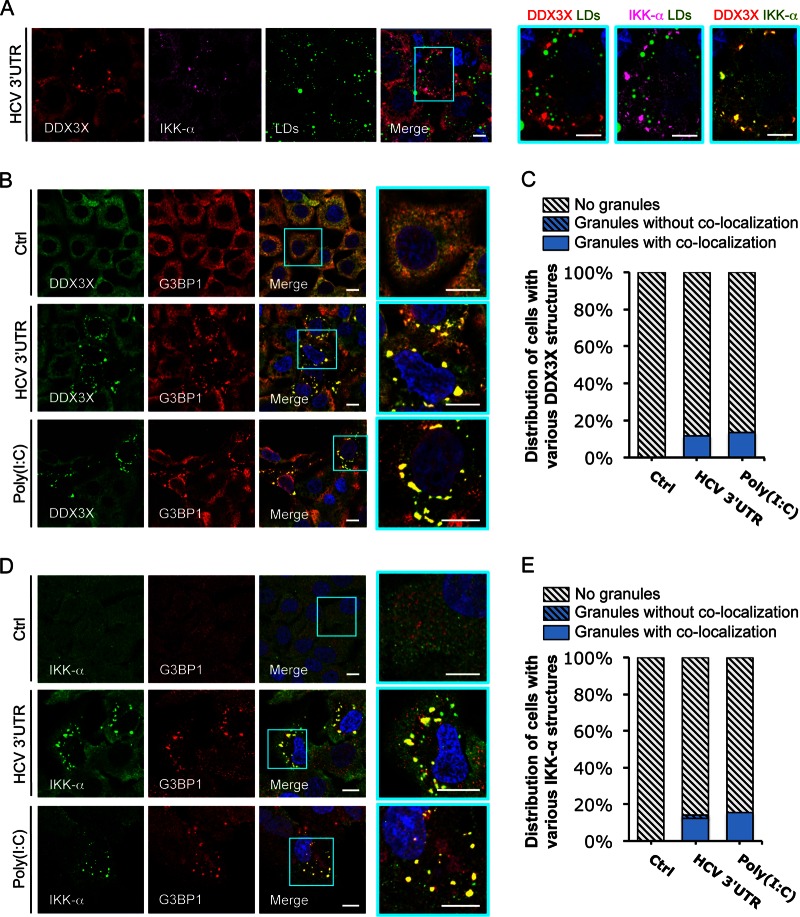
HCV 3′UTR RNA induces DDX3X–IKK-α colocalization in stress granules (SGs). Huh-7.5.1 cells were transfected with EGFP control (Ctrl) or HCV 3′UTR RNA for 24 h. Various cellular proteins and compartments were stained and subsequently examined by confocal microscopy. DDX3X (A and B) and G3BP1 (a SG marker) (D) were detected with specific primary rabbit antibodies, and IKK-α (A and D) and G3BP1 (B) were detected with specific primary mouse antibodies, followed by the secondary antibody Alexa Fluor 488 (green), 568 (red), or 647 (magenta). Lipid droplets (LDs) were stained with BODIPY 493-503 (green). Magnifications of selected areas are shown on the right. Scale bars, 10 μm. (A) DDX3X–IKK-α granules and LDs. Colors in the far right picture were digitally changed for better visualization of IKK-α (green instead of magenta) and DDX3X (red). (B) DDX3X and SGs. (C) Quantification of DDX3X structures in cells under various conditions. Confocal microscopic images (6 to 12 randomly selected fields from at least three independent experiments performed for panel B, at least 90 cells under each condition) were counted. Results shown are percentages of cells without DDX3X granules (light gray striped bars) or those with DDX3X granular structures either colocalized with SGs (blue bars) or not colocalized (blue striped bars). (D) IKK-α and SGs. (E) Quantification of IKK-α structures in cells that underwent various treatments. Confocal microscopic images (5 to 10 randomly selected fields from at least three independent experiments performed for panel D, at least 50 cells under each condition) were counted. Results shown are percentages of cells without IKK-α granules (light gray striped bars) or those with IKK-α granules either colocalized with SGs (blue bars) or not colocalized (blue striped bars).

