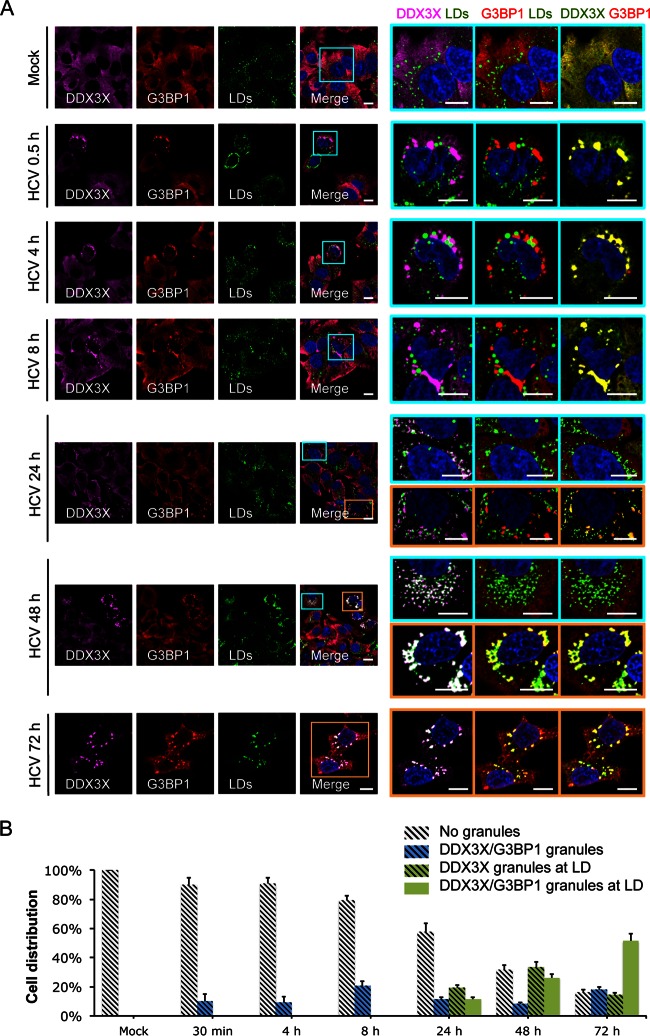
FIG 3.
Dynamic shift of DDX3X subcellular localization during HCV infection. (A) Huh-7.5.1 cells were mock infected or infected with JFH-1 HCVcc for 0.5 to 72 h. DDX3X, G3BP1, and LDs were stained, and their subcellular localizations and associations were examined. Magnifications of selected areas are shown on the right. Colors on the far right were modified for better visualization of DDX3X, shown in green instead of magenta. Scale bars, 10 μm. (B) Quantification of DDX3X colocalization with SGs and/or LDs. Five to 10 confocal microscopic pictures from at least three independent experiments with a total of at least 30 cells were analyzed for colocalization signals. Percentages of cells without granular structures (light gray striped bars) or presenting DDX3X granules that are colocalized with SGs only (blue stripped bars), LDs only (green striped bars), or both SGs and LDs (green bars) are shown.

