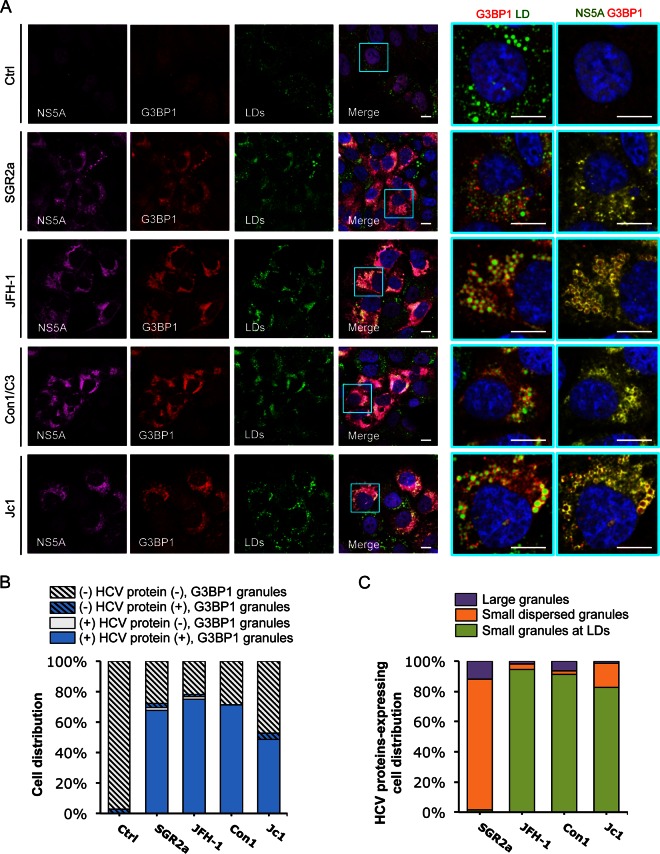
FIG 7.
Colocalization of HCV NS5A protein with SGs. In vitro-transcribed control RNA (Ctrl), SGR2a, JFH-1, Con1/C3, or Jc1 chimera RNA-transfected Huh-7.5.1 cells (as described for Fig. 6) were stained for HCV NS5A, SGs, and LDs. (A) Confocal microscopic imaging of G3BP1 (for SGs), NS5A, and LDs. Magnifications of selected areas are shown on the right. Colors in pictures on the far right were digitally changed for better visualization of NS5A (green instead of magenta) and G3BP1 (red). Scale bars, 10 μm. (B) Quantification of SGs in HCV protein-negative or -positive cells. Six to 12 randomly selected microscopic images from at least three independent experiments with a total of at least 80 cells were analyzed for the presence or absence of SGs in HCV protein-positive or -negative cells. Results shown are percentages of cells that are HCV protein negative and either with (blue striped bars) or without (light gray striped bars) SGs and cells that are HCV protein positive and either with (blue bars) or without (light gray bars) SGs. (C) Characterization of SGs in HCV protein-positive cells. This population of cells, which also presents SGs (blue bars in panel B), were further classified into three groups: cells with a few large SGs not associated with LDs (purple bars), cells with G3BP1 granules dispersed throughout the ER (orange bars), and cells with small and numerous SGs localized to LDs (green bars). Percentages of HCV-positive cells (in a total of at least 40 cells) in each group are shown.

