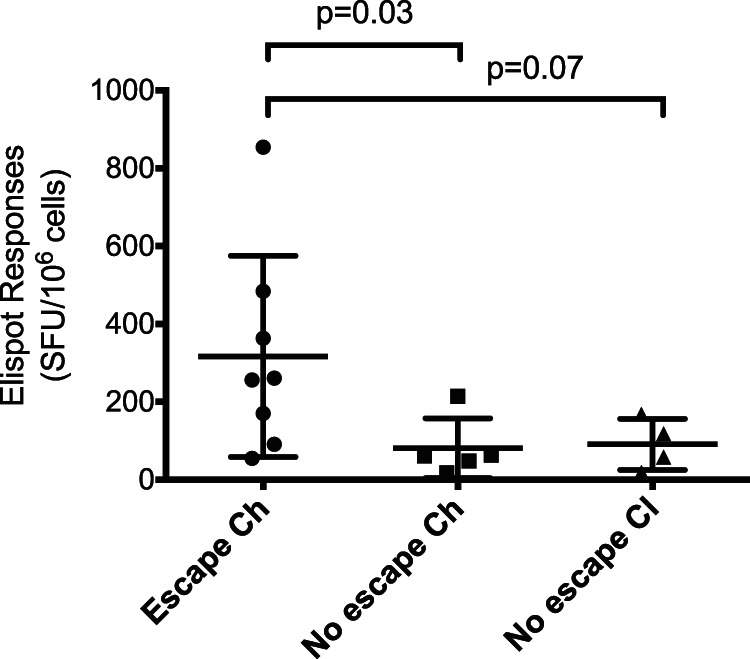
FIG 6.

Magnitude of CD8+ T cell response associated with escape. The CD8+ T cell responses measured via ELISpot assay for each T/F epitope during the first 101 days p.i. was compared between epitopes that underwent escape (n = 2 in Ch_23 and n = 2 in Ch_240, for a total of 8 immune responses) and those that did not (n = 9). The conserved epitopes were also further divided based on disease outcome. The epitopes that elicited greater IFN-γ ELISpot responses were more likely to have escape variants emerge (P = 0.03). Statistical comparisons are Mann-Whitney tests. Scatter plots represent means ± 1 standard deviation.
