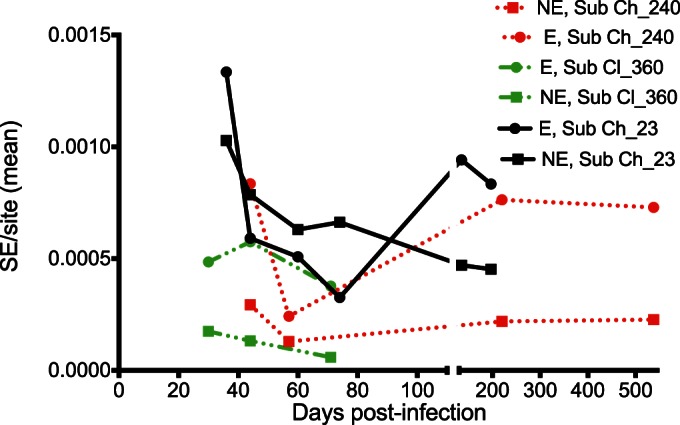
FIG 7.

Mean Shannon entropy (SE) per site in epitope regions (E) and nonepitope regions (NE) calculated over time for the three subjects. Following a decline in the Shannon entropy per site within the first 100 days p.i. for all three subjects, the diversity index increased in the chronic phase of the infection. The mean Shannon entropy per site was generally higher within the epitope regions.
