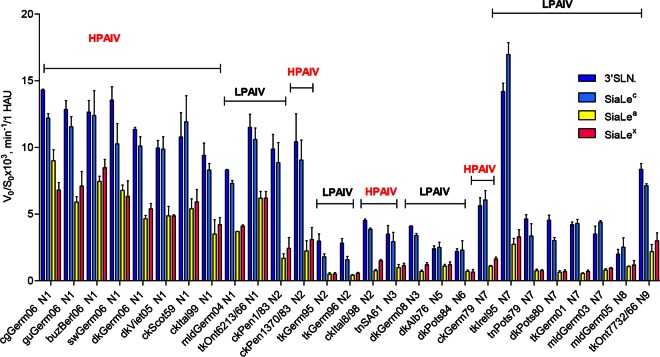
FIG 7.
NA substrate specificity of the avian influenza viruses was calculated for each sialoside as the slope of the linear region of the V0-versus-S0 kinetic curve (V0, initial rate of the desialylation; S0, initial substrate concentration). Substrate specificity of each virus NA was determined by comparison of V0/S0 values obtained for all substrates under the same conditions. Colors indicate the sialyloligosaccharide moiety of the SGP. Data are presented as indicated on the y axis, calculated for 1 HAU of virus. See Fig. 2 for virus abbreviations.

