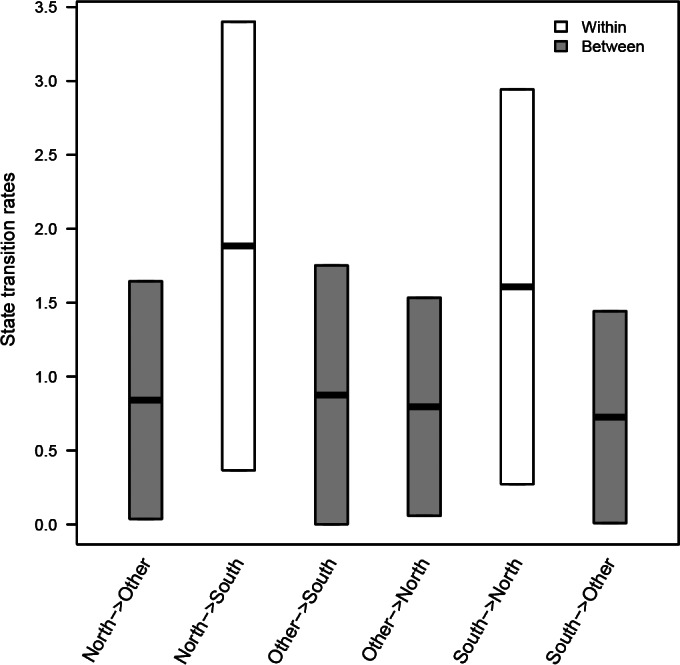
FIG 2.

Box plots of the 95% HPD joint migration rate estimates combined across all BEAST discrete phylogeography randomized runs for avian-origin influenza A viruses sampled in the Mississippi Migratory Flyway (North and South) and isolates from the IRD (Other). Rate estimates included all PB2, PB1, PA, NP, and MP gene segments collected in this study and those publically available in the Influenza Research Database/GenBank.
