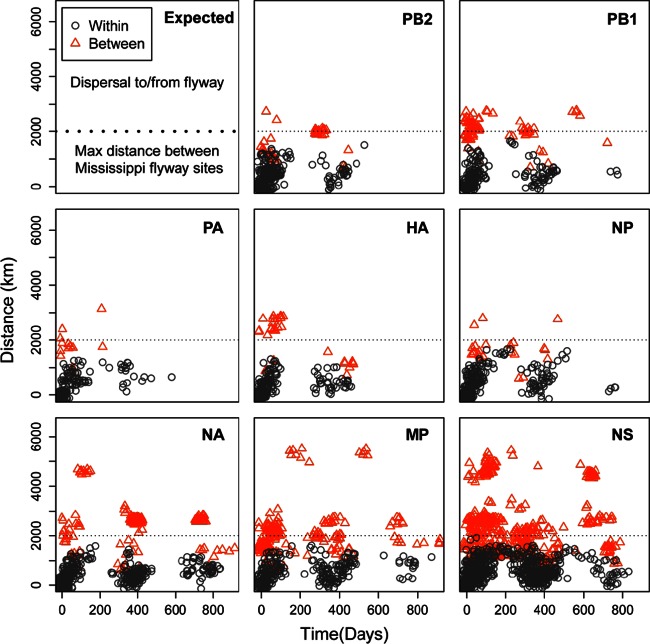
FIG 3.
Plots representing all high-identity pairwise comparisons at the 1% cutoff value for each segment over geographic distance (km) and time (days) within the Mississippi Migratory Flyway. Gray points represent pairwise matches between two segments of MMF influenza virus isolates, while orange points represent pairwise matches between an MMF isolate and an isolate from another North American flyway.

